

The most popular advice on this topic fits on a box. Slow swing, play a soft ball. Fast swing, play a firm ball. That advice isn't useless, but it skips the question that decides scores. It doesn't tell a golfer what happens to launch, spin, dispersion, and wedge control when two balls meet the same swing. Golf balls with low compression deserve a better test than a swing speed chart. Speed can pick the first ball to try. Only measured averages at that player's real speed can pick the ball to keep.
Table of Contents
- What Low Compression Means on a Golf Ball
- Swing Speed Bands for Low Compression Balls
- Test Balls on a Launch Monitor
- Why Fast Swingers Still Try Softer Balls
- Driver Distance Versus Wedge Control
- Cold Weather Changes Ball Speed More Than Compression
- Pick a Ball Then Log the Next Session
What Low Compression Means on a Golf Ball
Low compression generally means a rating of about 80 or below, and ultra-low models are often 70 or below. That's the working definition a golfer can use in a shop today. The number describes how much a ball deforms under a specified load. A lower number means the ball flattens more readily under less force.
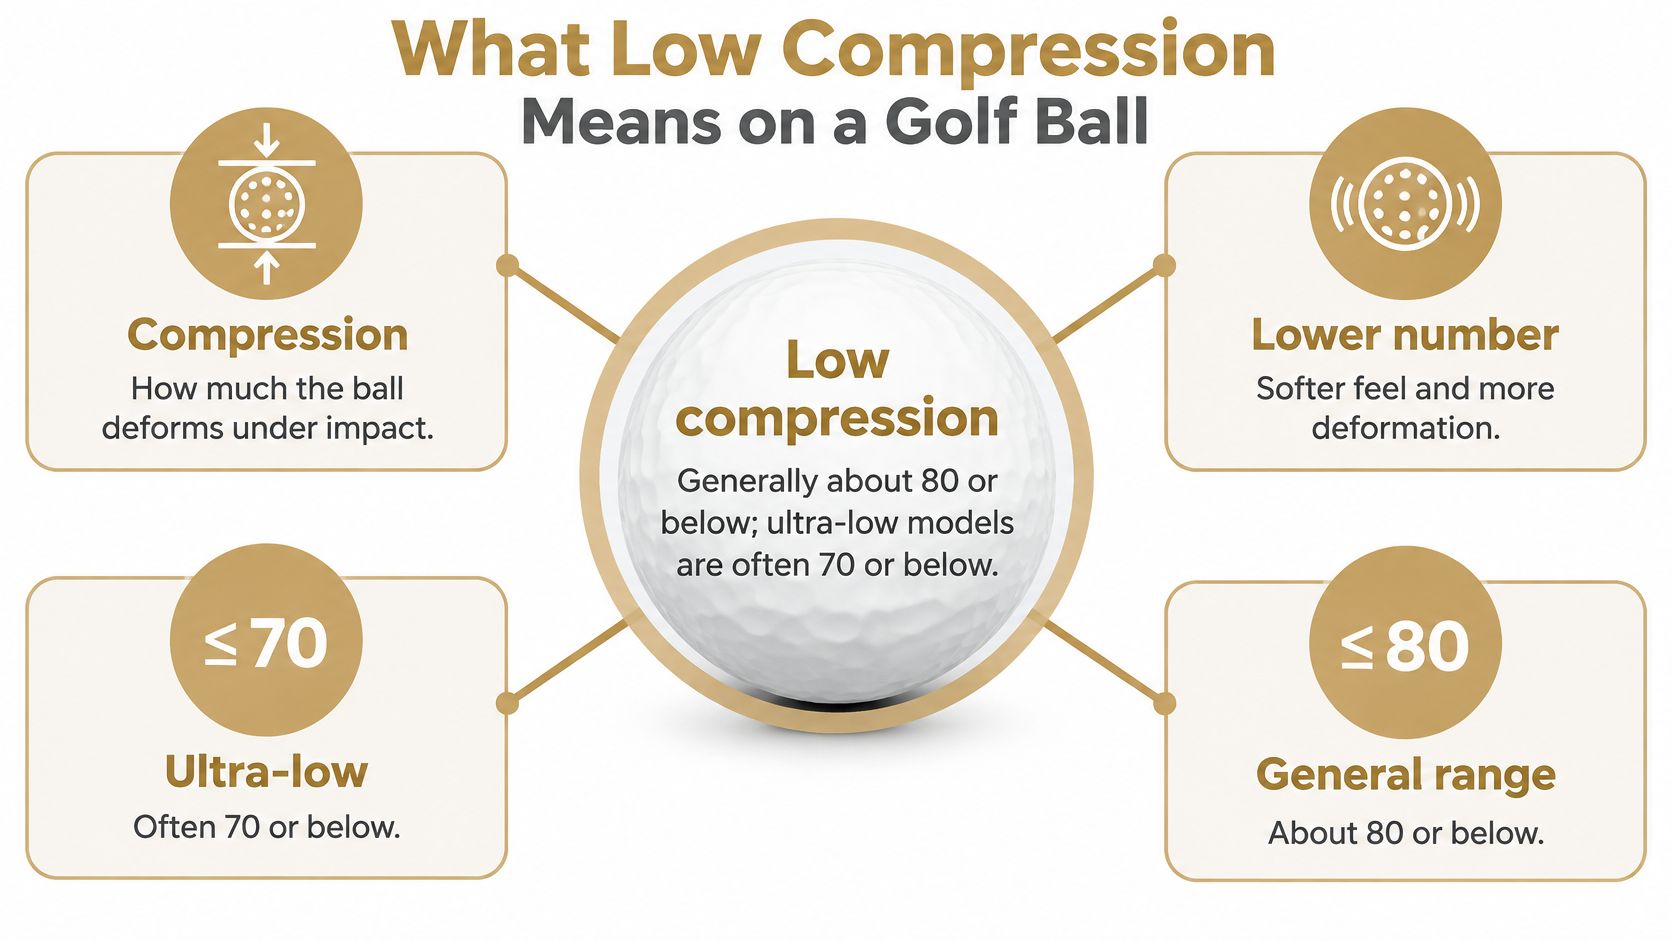
A simple press test makes the idea physical. Put a marshmallow and a baseball under the same press. The marshmallow gives right away, while the baseball resists and barely changes shape. Golf balls sit between those extremes, but the principle holds. A softer ball deforms more for the same push.
Where the Number Came From
The idea traces back to the Atti compression scale. According to a Seoul Economic Daily explainer on low compression distance balls, that scale ran from 0 to 200, and a reading of 100 represented approximately 0.1 inches of deformation under the test's specified loading conditions. Modern golfers still talk in compression points, but the number is not a universal standard.
Brands and labs don't all test the same way. They may use different devices, loads, and procedures, so a rating from one source isn't directly interchangeable with a rating from another. That's why two balls with different published numbers can feel similar in the hand. It's also why an independent test can land several points away from the box.
Practical rule: Treat a compression rating as a clue inside one testing system, not as a passport that travels unchanged across every brand.
How Soft Modern Balls Have Become
Design has shifted a long way. Golf Digest reported that older two-piece, Surlyn-covered balls commonly measured about 90 to 100 compression, whereas comparable modern two-piece balls were generally in the 50 to 70 range in its 2009 review. Recent testing sits even lower at the soft end. Today's Golfer reported in 2025 that Pinnacle Soft measured 35 compression and Srixon UltiSoft measured 36 compression, making them the softest and second-softest balls in that test.
None of that proves which ball flies farthest for a given player. Cover material, core construction, temperature, and test method all shape feel and measured deformation. Compression names one property of the ball. It doesn't describe the whole flight.
Swing Speed Bands for Low Compression Balls
A speed chart works best as a shopping list, not a verdict. Each row below names a first ball to try, then the tradeoff that could push a golfer out of that row.
Low-compression starting points by driver speed
| Driver speed | Ball to try first | Compression band | Main tradeoff |
|---|---|---|---|
| Under 75 mph | Lower-compression, higher-launch balls | About 30-70 | Prioritize carry and soft feel before premium wedge spin |
| 75 to 85 mph | Soft to mid-compression balls | About 30-70 to mid | Keep enough iron spin to hold greens |
| 86 to 95 mph | Mid-compression balls | Mid | Balance matters more than maximum firmness |
| 96 to 105 mph | Mid-firm and tour-style balls | Mid-firm | Controlled launch and spin, especially in wind |
| 106 mph and above | Firmer tour profiles | Firm | Works when launch and spin stay controlled |
| 85-100 mph | Mid-compression, unless spin or feel points elsewhere | Mid | A 90 mph swing usually needs balance, not the firmest tour ball |
The broad pattern matches a Ball Caddie fitting framework for choosing a ball by swing speed, which places driver speeds below 85 mph in the low-compression range of roughly 30 to 70, speeds of 85 to 100 mph with mid-compression balls, and speeds above 100 mph with firmer designs. A softer core can deform sufficiently without the impact force a high-speed swing produces. That's why the low end of the chart leans soft.
Reading the Slower Bands
Under 75 mph, carry usually needs help before greenside check does. A higher-launch, lower-compression ball gives the flight a chance to stay in the air. Soft feel on putts and chips is a real benefit at this speed, and premium wedge spin matters less if approaches arrive low and running anyway.
From 75 to 85 mph, the decision tightens. Soft to mid-compression balls remain sensible, but the golfer now needs enough iron spin to hold a green. Chasing a few extra yards off the tee makes little sense if every approach releases through the back fringe. Ball speed context helps here, and a driver ball speed chart shows how club speed and ball speed relate before a player blames the ball.
Reading the Middle and Faster Bands
From 86 to 95 mph, most players fit somewhere in the middle. Driver spin, wedge spin, or feel can still point softer or firmer. A 90 mph swing doesn't automatically need the firmest tour ball in the range bucket. It needs a flight that carries, holds its line, and stops often enough.
From 96 to 105 mph, mid-firm and tour-style balls enter the conversation when launch and driver spin stay controlled. Wind exposes a ball that climbs and stalls. At 106 mph and above, firmer tour profiles often make sense for players who already manage launch and spin well.
A speed band can't see a steep delivery, a low strike on the face, or a player who spins every driver too much.
Cover material, dimple design, swing delivery, and the player's own launch and spin can outweigh the label. The chart narrows the shelf to two or three candidates. Average ball speed, launch, spin, and carry make the final call.
Test Balls on a Launch Monitor
A fair comparison needs a protocol before it needs an opinion. The five steps below keep one hot shot from deciding the bag.
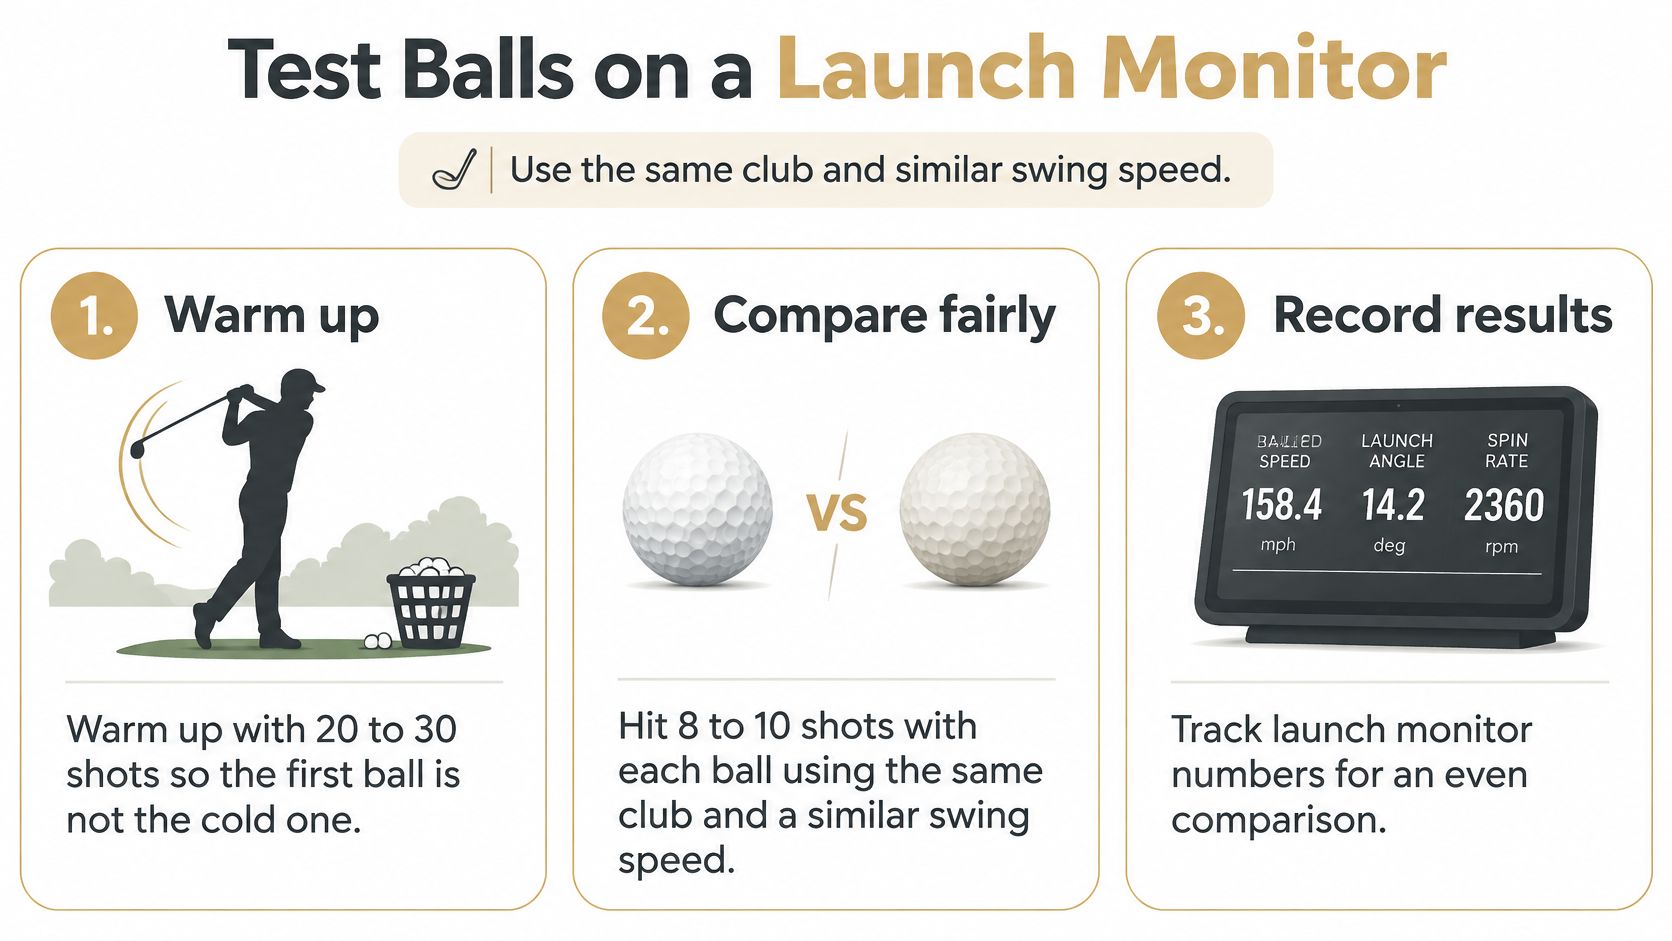
- Warm up first. Hit 20 to 30 shots so the first ball tested isn't the cold one.
- Hit enough shots per ball. Hit 8 to 10 shots with each ball, using the same club and a similar swing speed.
- Record the same fields. Log ball speed, spin rate, launch angle, and carry distance for every shot.
- Average carefully. Discard the worst shot, then average the rest.
- Repeat beyond the driver. Run the same routine with a 7-iron and a wedge.
That structure follows a Golf Launch Lab ball fitting protocol, which recommends warming up with 20 to 30 shots, then hitting 8 to 10 shots with each ball while recording ball speed, spin rate, launch angle, and carry distance, with the worst shot discarded before the average is calculated. Averages protect the golfer from memory. Most players remember the one drive that flew the bunker and forget the four that didn't.
Why Spin Deserves the Closest Look
Ball speed gets the attention, but spin often shows the bigger separation. In a controlled robot study comparing 70 and 120 compression balls at 70-mph and 110-mph driver-head speeds, the firmer 120-compression ball produced only about 1 to 2% higher ball speed and smash factor, while launch angle was about 1 to 2% lower. The largest difference was spin. The 120-compression ball generated approximately 12 to 13% more spin than the 70-compression ball at both tested speeds.
That finding changes the fitting question. A softer ball may help when a player needs higher launch or reduced driver spin. Cutting spin too far carries a cost, though. If launch is already low, excessive spin reduction can reduce stopping power and carry consistency, because the ball has less lift holding it in the air.
Reference spin windows for comparison
| Club | Reference window | How to use it |
|---|---|---|
| Driver | 2,000-2,800 rpm | Comparison range for averages, not a target |
| 7-iron | 5,500-7,500 rpm | Comparison range for averages, not a target |
These windows give context for an average, nothing more. A player who launches the driver high can live happily at one end. A low launcher may need the other end just to keep carry stable. Choosing where to run the session matters too, and guidance on the best launch monitor for driving range use covers the setup side of that choice.
Watch the Bag, Not Just the Driver
Say two balls carry the driver the same distance in a session. One of them then flies the 7-iron shorter and flatter, close enough to the next club that the gap between irons shrinks. The driver number didn't move, but the bag changed. A golfer who only tests off the tee would miss that completely and discover it over a pond.
Fitting check: If a ball wins the driver test and quietly breaks iron gapping, it hasn't won anything yet.
The record matters as much as the session. Dialed Golf desktop live-pairs a Garmin R10 first, with more monitors expanding, and imports CSV files from Garmin, Rapsodo, SkyTrak, FlightScope, Uneekor, GSPro, Awesome Golf, and others. Its free web golf ball fitter stays free as the starting filter. Pro is the optional ongoing record, not the price of running the test.
Why Fast Swingers Still Try Softer Balls
The claim that golf balls with low compression are only for slow swings doesn't survive contact with testing. The setup below shows the kind of side by side session that settles the question for one player.
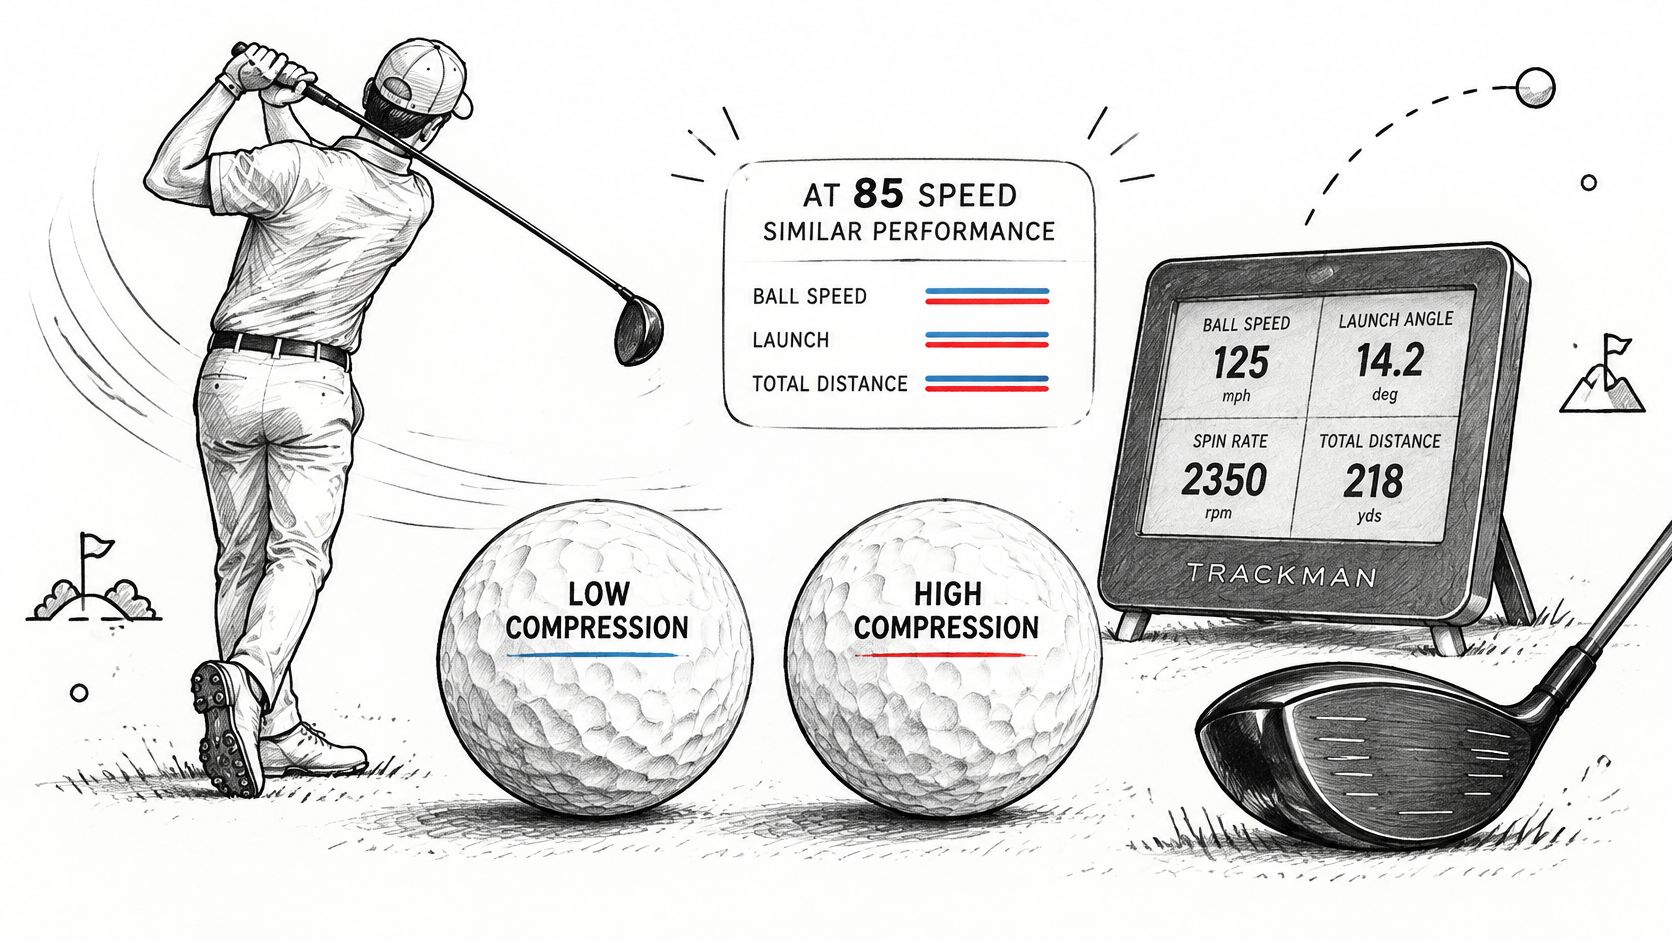
MyGolfSpy's testing of soft feel golf balls found comparable coefficient of restitution for low- and high-compression balls at 85, 102, and 119 mph, with no meaningful evidence that low-compression balls lose ball-speed performance at higher impact speeds. Coefficient of restitution describes how efficiently the ball rebounds after impact. If a soft ball keeps pace there at 119 mph, the old rule needs rethinking.
The better question is narrower. When does a softer ball improve launch, dispersion, feel, or scoring for a player who already swings fast? A speed chart can't answer that, because it can't see ball speed, launch angle, spin, descent angle, or how the club is delivered into the ball.
Two Fast Players, Two Different Answers
Say a player near 105 mph spins the driver around 3,200 rpm into the wind. Those drives climb, stall, and drift. A lower-spinning soft ball could flatten that flight and tighten the pattern, provided the wedges still hold a green. For that player, softer isn't a concession. It's a spin fix.
Another fast player launches the ball low and depends on greenside grab to save par. Driver carry might look fine with a soft ball. The scoring shots suffer, though, because approaches land hot and pitches don't check. Same speed range, opposite verdict. Watching a full comparison unfold shot by shot makes that split easier to read.
Run Three Balls at One Speed
A same-speed comparison settles it. Put a low-, mid-, and high-compression ball through the same session and score each on carry, total distance, peak height, spin, and offline dispersion, then check wedge stopping power. The launch monitor steps in the test section give the routine, so there's no need to build a new one.
The result won't produce a universal chart. It produces individualized evidence, which is more useful. Faster swingers don't automatically need firmer balls, and slower swingers don't automatically need the softest ball on the shelf. The averages decide.
Driver Distance Versus Wedge Control
Ball construction splits one decision into two. The core and inner layers do most of the work at driver speed, where deformation is large. Around the green, impact is slower and the cover takes over. A ball can therefore be a distance answer and a control problem at the same time.
MyGolfSpy's 2021 robot-tested ball guide found low-compression balls consistently among the lowest-spinning options across driver, iron, and wedge tests, while slower players below roughly 85-mph driver speed often showed very small ball-speed differences between soft and firm models, with low-compression balls slightly faster on some iron shots. Low spin everywhere sounds tidy. On a wedge shot, low spin is often the problem.
Judge the Fit in Two Halves
- Driver half: Compare launch, ball speed, and spin to see whether the ball carries farther and straighter.
- Iron half: Hit a 7-iron and watch trajectory and descent angle, because a flatter arrival runs out more on landing.
- Wedge half: Check whether a pitch checks, releases a little, or skids through the green.
That sequence keeps a tee shot from outvoting three scoring clubs. Technique matters inside it too, and a refresher on how to hit a wedge helps separate a strike problem from a ball problem before the averages get blamed on equipment.
The Cover Decides Around the Green
Greenside spin comes largely from how the cover interacts with the grooves. At low clubhead speeds, the ball slides and grips against the face rather than fully compressing. A soft core underneath can't promise check if the cover won't grab. This is the point golfers most often miss when a ball feels soft off the putter and still won't stop on a pitch.
A urethane cover on a softer ball can still hold a green well. An ionomer or Surlyn cover often releases even when the core feels soft in the hand. Feel and friction are different properties. The thumbnail test in a shop measures neither one properly.
A ball that feels soft on a putt hasn't proven anything about a 50-yard pitch yet.
Picture a 140-yard approach that lands pin high and runs 15 yards past the hole. The driver may have gained a few yards all day. That approach still turned a birdie look into a long comeback putt. Keep the ball that improves carry and dispersion without dropping iron descent or wedge control past what the player accepts on the course.
Cold Weather Changes Ball Speed More Than Compression
Does a softer ball fix winter distance loss? Not by itself. Ball temperature, air temperature, and storage act separately from the compression label, and golfers often blur the three together.
SwingU's summary of laboratory cold weather testing reported that six hours in a freezer changed compression by only two to three points, whereas one hour at 115°F reduced compression by more than 15 points. A hot car trunk can move the number more than a cold morning does. Storage is part of the equipment decision whether a golfer treats it that way or not.
What a Frozen Ball Actually Costs
The same testing found that frozen balls lost more than 6 mph of ball speed and over 21 yards of distance at a 100-mph driver speed. The cold ball also launched lower and spun nearly 500 rpm more. Those are losses a player might wrongly blame on a swing change or a ball model.
A Routine That Keeps the Test Fair
- Start even: Bring every test ball to a similar temperature before the session begins.
- Store sensibly: Keep balls away from freezing garages and hot trunks alike.
- Log conditions: Record ball temperature and air temperature beside the monitor numbers.
Run the same warm-up and averages at the same temperature before comparing balls. A cold session can look exactly like a bad ball. These lab figures come from one controlled set of tests, so a golfer should confirm the size of the effect with personal launch-monitor data. Even a rough hometown version beats guessing.
Pick a Ball Then Log the Next Session
The keep rule is short. Keep the ball that wins on average carry and dispersion at the player's real speed without giving up acceptable iron descent and wedge stop. If two balls finish within a yard or two, choose by feel and by how much a lost ball costs. The lowest number on the box isn't a tiebreaker.
The next action is one controlled session, saved as driver, 7-iron, and wedge averages. Then the ball earns a retest after a few rounds, not a replacement because of one long drive on a firm fairway. Golfers change, weather changes, and a saved baseline shows which one moved.
Where the Record Lives
Dialed Golf keeps that history as one golfer record across its consumer app, desktop, and one Pro plan. The consumer app is a pocket caddy on TestFlight now, not a general App Store release. Desktop is where live launch-monitor practice starts, with Garmin R10 pairing first and mobile live pair coming later.
Golfer Pro runs $9.99 a week, $29.99 a month, $149.99 for six months, or $249.99 a year across app and desktop. The free web tools remain the front door and stay free. A compression chart starts the search, a launch monitor narrows it, and a saved record finishes it.
Pick two or three candidate balls, run them through one same-speed session, and save the driver, 7-iron, and wedge averages instead of trusting the longest shot of the day. Dialed Golf keeps those sessions in one golfer record across its pocket caddy app and desktop launch-monitor practice, so the next ball test builds on real history rather than memory. Start with the free tools and explore the record at Dialed Golf.