

PGA Tour drivers average 171 mph ball speed, while the average male amateur sits at 133 mph and a 5-handicap male averages 147 mph. That gap is why a driver ball speed chart matters, it shows how much distance lives inside strike quality and launch conditions, not just raw swing effort. TrackMan's ball speed benchmark data gives the cleanest reference frame for reading those numbers correctly.
A lot of golfers treat ball speed like a score to chase. That's the wrong lens. Ball speed is a diagnostic, because it tells you how efficiently the club delivered energy at impact, and the chart only becomes useful when you pair it with launch, spin, and smash factor. The static table is the starting point. The value is figuring out why your numbers land above or below it.
Table of Contents
- What the Driver Ball Speed Chart Shows
- Ball Speed, Club Speed, and Smash Factor Explained
- The Core Chart by Ball Speed
- Skill Band Benchmarks and Handicap Ladders
- Why the Same Ball Speed Can Produce Different Carry
- Using Ball Speed to Inform Club Fitting
- Practice Priorities That Move the Ball Speed Number
- Attack Angle and the Efficient Ball Speed Window
- Turning the Chart Into a Personal Benchmark
- Frequently Asked Questions About Driver Ball Speed
What the Driver Ball Speed Chart Shows
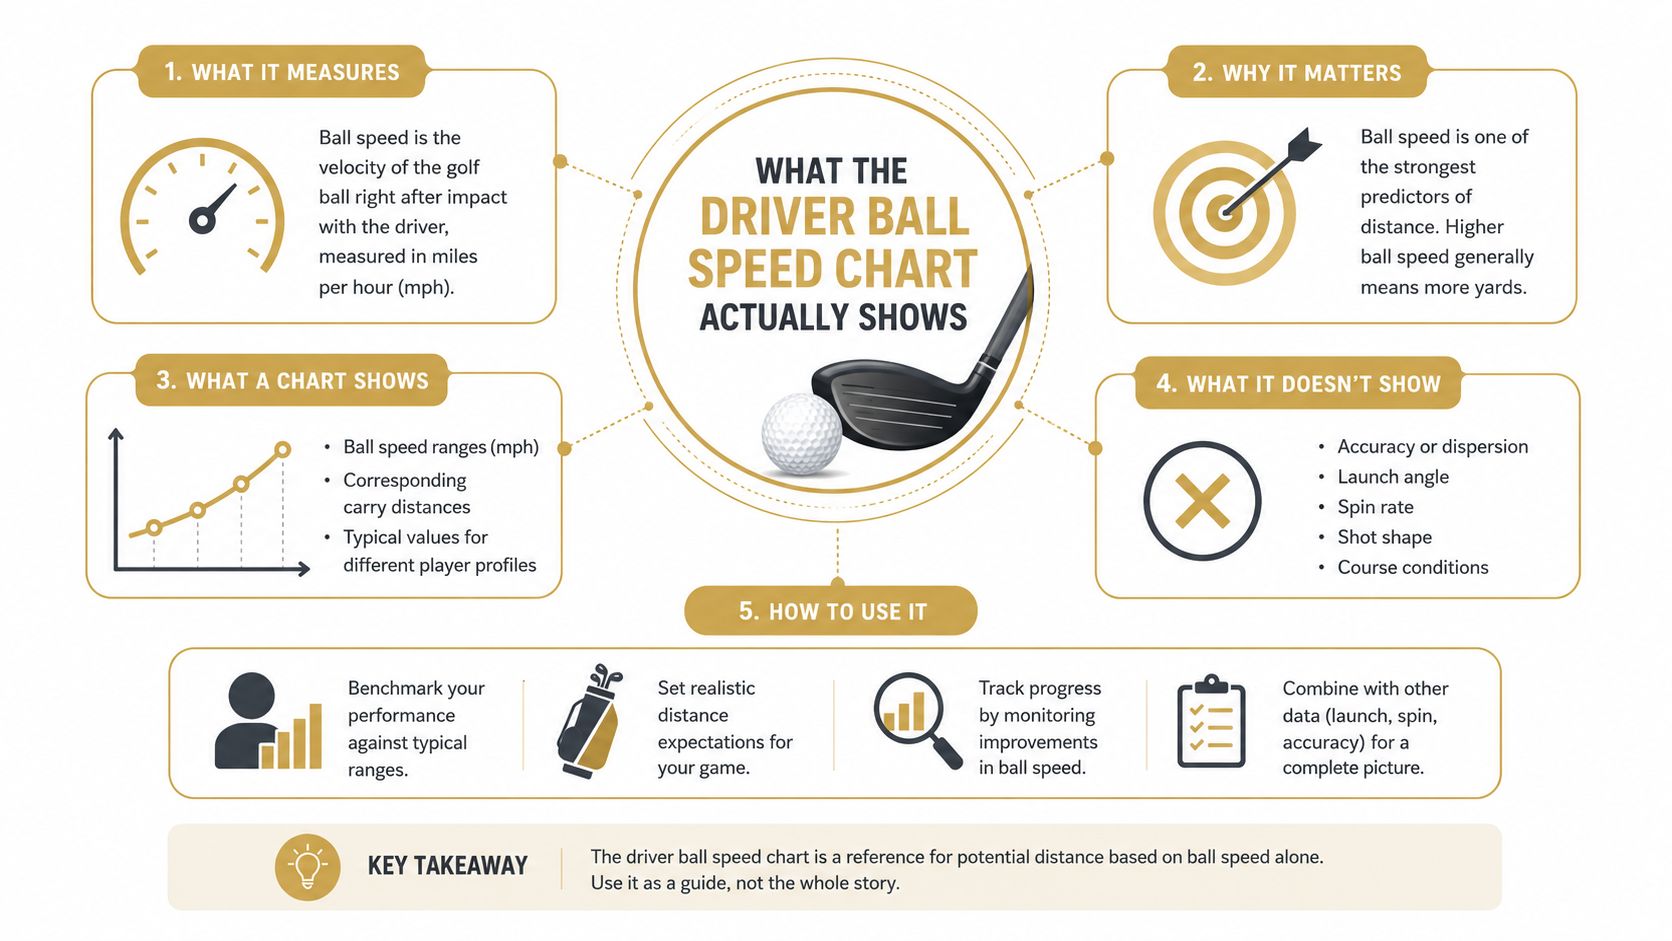
A driver ball speed chart links ball speed to expected carry and total distance. That makes it a diagnostic reference, not a target in isolation. TrackMan's published averages place a PGA Tour player around 171 mph and the average male amateur around 133 mph, a gap large enough to reshape how golfers interpret any distance table they see online TrackMan.
What the chart is doing
The chart is not a promise. It is a performance envelope built around launch and spin conditions that let speed turn into carry efficiently. When launch is in range and spin stays in a useful window, the chart shows what that ball speed can produce. When those inputs drift, the chart becomes a ceiling instead of a forecast.
That is why the same ball speed can point to very different outcomes. A 5-handicap male at 147 mph sits much closer to elite ranges than the average golfer at 133 mph, which shows how much distance depends on strike quality, not just effort. A player who swings faster but leaks contact can sit below the charted carry for that speed, while another player with cleaner impact can reach it with less club speed.
Practical rule: if your ball speed matches a higher tier but your carry does not, the issue is usually launch, spin, or strike quality.
The chart is most useful when you use it as a checkpoint. A fitter can use it to see whether a player is underperforming their speed. A golfer can use it to set a realistic distance target. A coach can use it to separate a real efficiency gain from a swing that feels faster. Dialed Golf can help here by giving you a place to log ball speed alongside strike notes, launch conditions, and the setup changes you tried, so the number becomes something you can compare and act on instead of just admire.
Ball Speed, Club Speed, and Smash Factor Explained
Ball speed, club speed, and smash factor are the three numbers that make the chart meaningful. Ball speed is the speed of the ball immediately after impact. Club speed is the speed of the clubhead at impact. Smash factor is the ratio between them, so it tells you how efficiently speed transferred into the ball. That's why two golfers can post similar driver ball speeds while swinging very differently.
Why identical ball speed doesn't tell the whole story
Tour driver averages sit around 167 to 171 mph ball speed with about 1.48 to 1.49 smash factor, while amateur reference charts place a male amateur around 132 mph and a “good” amateur around 140 to 150 mph PGA averages reference. The gap suggests that the same ball speed can come from very different club-speed profiles. One golfer may be swinging faster but leaking efficiency. Another may be creating better contact at a slightly lower club speed.
That distinction matters because ball speed is the number that survives the chaos of the swing. Club speed tells you the input. Smash factor tells you how well the input was used. Ball speed tells you what the shot got. If you only track club speed, you can miss a contact problem that's capping distance.
How launch monitors create the number
Launch monitors infer these metrics from impact data and flight data, then calculate the output you see on screen. That's why ball speed is so useful in a fitting bay or a practice session. It gives you a repeatable way to compare strikes, even when the swing feels different.
Short version: higher smash factor means more efficient energy transfer, which gives you more headroom to gain distance without just swinging harder.
If two golfers post the same ball speed, the one with the higher smash factor usually has a better path to more carry, because they're starting from a more efficient strike pattern. That doesn't mean speed is irrelevant. It means speed only becomes valuable once impact is doing its job.
The Core Chart by Ball Speed
A driver ball speed chart becomes useful when you read it as a range of outcomes, not as a promise. The strongest patterns in TrackMan-aligned optimization work place major carry gains in the faster ball-speed bands, and the educational charts built from that same measurement tradition show why the jump from one row to the next matters TrackMan driver optimization document. Those rows assume efficient launch and spin, usually around 11 to 14 degrees of launch and about 2,100 to 2,700 rpm of spin, so the chart works best when the strike is stable and the ball is leaving on a playable window Golf Launch Lab fitting reference.
| Ball Speed (mph) | Carry (yards) | Total (yards) |
|---|---|---|
| 120 | 185 | about 200 |
| 130 | 200 to 210 | about 215 to 225 |
| 135 | 222 | about 235 |
| 140 | 215 to 230 | 234 |
| 150 | 235 to 250 | 254 to 275 |
| 160 | 260 to 275 | about 280 to 295 |
| 170 | 280 to 300 | about 300 to 325 |
The table is most useful when you read across a row and ask what kind of shot produced that outcome. A 120 mph ball-speed strike can still carry well if launch and spin are cooperating, but it leaves less margin for error when strike quality slips. A 135 mph row is different from a 150 mph row because the latter gives you more distance without needing a dramatic change in contact pattern.
The chart also exposes where the static number starts to break down. A player can post the same ball speed and still miss the listed carry if launch is too low, spin is too high, or attack angle is creating excess drag. For that reason, the row matters less than the window around it, especially in fitting or practice sessions where you want to know whether the shot was efficient or just fast.
How to use the rows that matter to you
If you sit near 130 mph, the table says you should treat the next row as a practical target band, not a distant ideal. That means comparing your strike pattern, launch, and spin against the carry range beside it, then checking whether the result matches the window or falls short because of contact. If you sit near 150 mph, the next gains usually come from cleaner delivery and tighter launch control, not from chasing a higher speed number with the same impact pattern.
The point is to find the row that describes your current shots, then use that row to judge whether the launch conditions are helping or hurting the carry. A golfer who wants a simple way to compare those yardages can log shots against a carry distance chart in Dialed Golf and see whether ball speed changes are translating into actual distance gains or just noisier numbers.
Use the closest row as your benchmark, not the farthest row as your fantasy. That is how the chart becomes a fitting tool instead of a vanity metric.
What matters next is whether the ball is producing the carry that row implies. If it is not, the fix is usually in the inputs, launch, spin, or attack angle, not in the chart itself.
Skill Band Benchmarks and Handicap Ladders
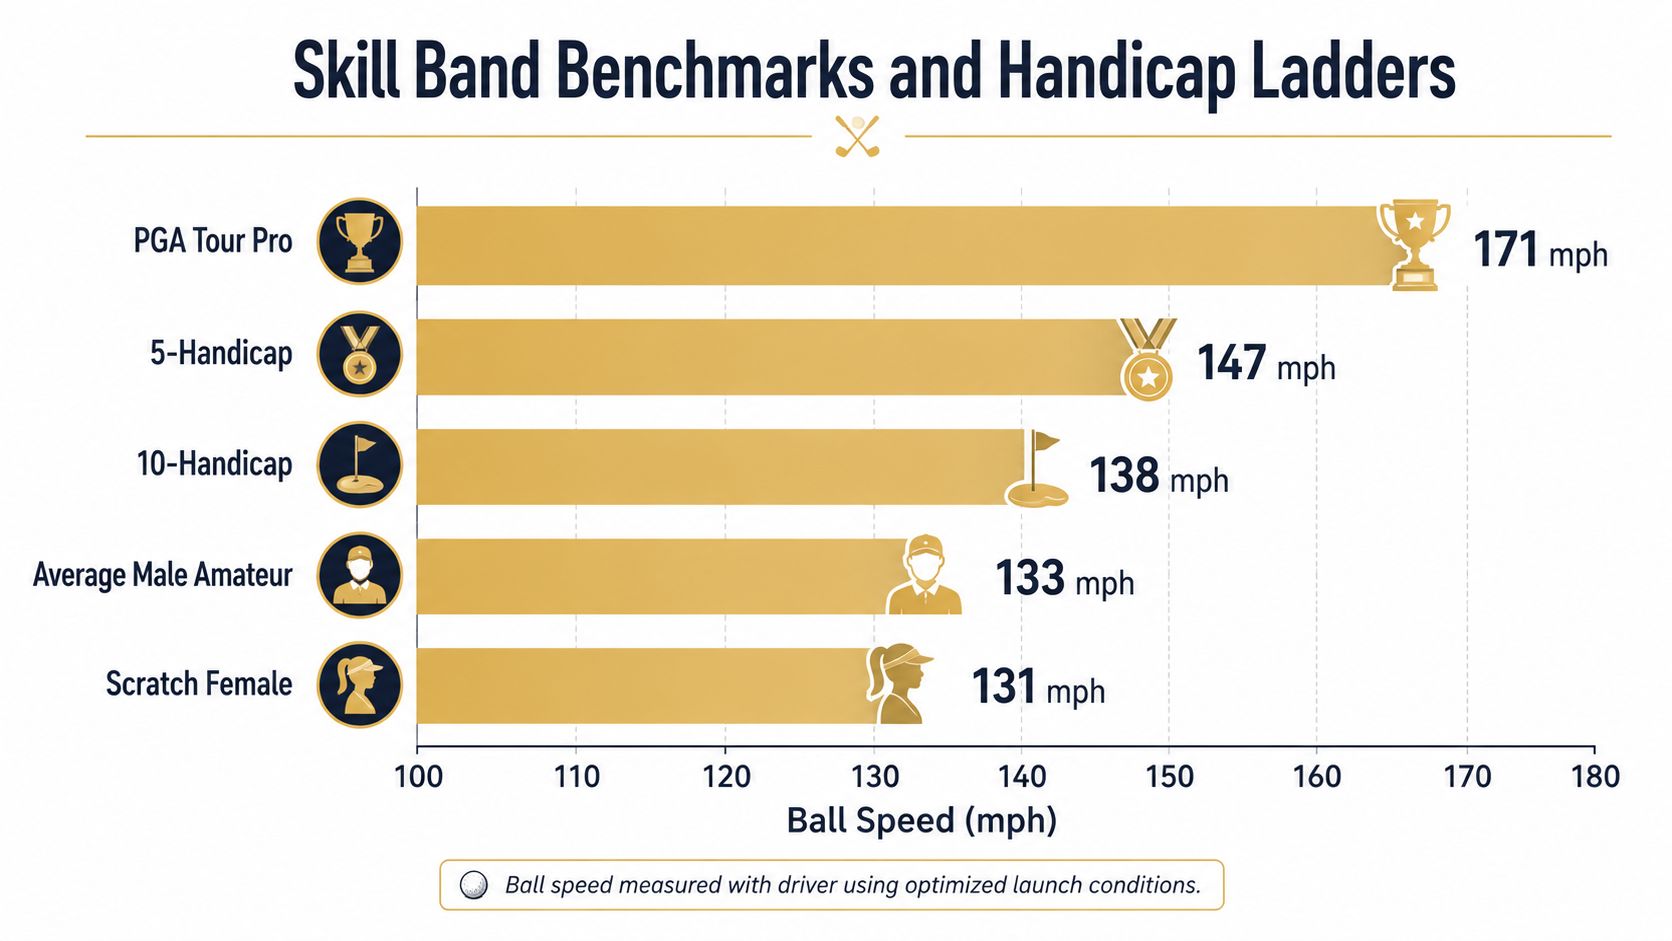
Skill level gives the chart its context. TrackMan's published driver averages show a PGA Tour player at 171 mph, a 5-handicap male at 147 mph, a 10-handicap male at 138 mph, an average male amateur at 133 mph, and a scratch-or-better female at 131 mph TrackMan. Those are not just benchmark points. They're a ladder for reading where your current speed sits relative to your scoring level.
What each band tends to mean
A PGA Tour number is not just faster, it's more repeatable. That's part of why the chart is so useful for context, the elite benchmark sits far above the amateur center of gravity. A 5-handicap is already much closer to elite speed than the average golfer, which is a reminder that small efficiency gains can separate a player from the field faster than raw strength does.
The average male amateur at 133 mph sits in the middle of the common recreational range, while the 10-handicap at 138 mph represents a modest but meaningful increase TrackMan. That gap isn't huge on paper, but it changes carry, turf interaction, and how much room a player has to miss and still reach a target.
Reading your number against your handicap
If your ball speed is well above your handicap band, the question becomes consistency. If it's below the band, the issue may be contact, launch, or equipment fit. Either way, the chart is most valuable when it's read against your scoring profile, not in isolation.
The same logic appears in fitting and gapping workflows. Dialed Golf's USGA handicap calculator gives a formal way to anchor that comparison, especially if you're trying to decide whether your driver speed is carrying your game or masking another weakness.
A player at 147 mph is not just “a little better” than a player at 133 mph. They're operating in a different distance window, which affects club selection all the way down the bag.
Why the Same Ball Speed Can Produce Different Carry
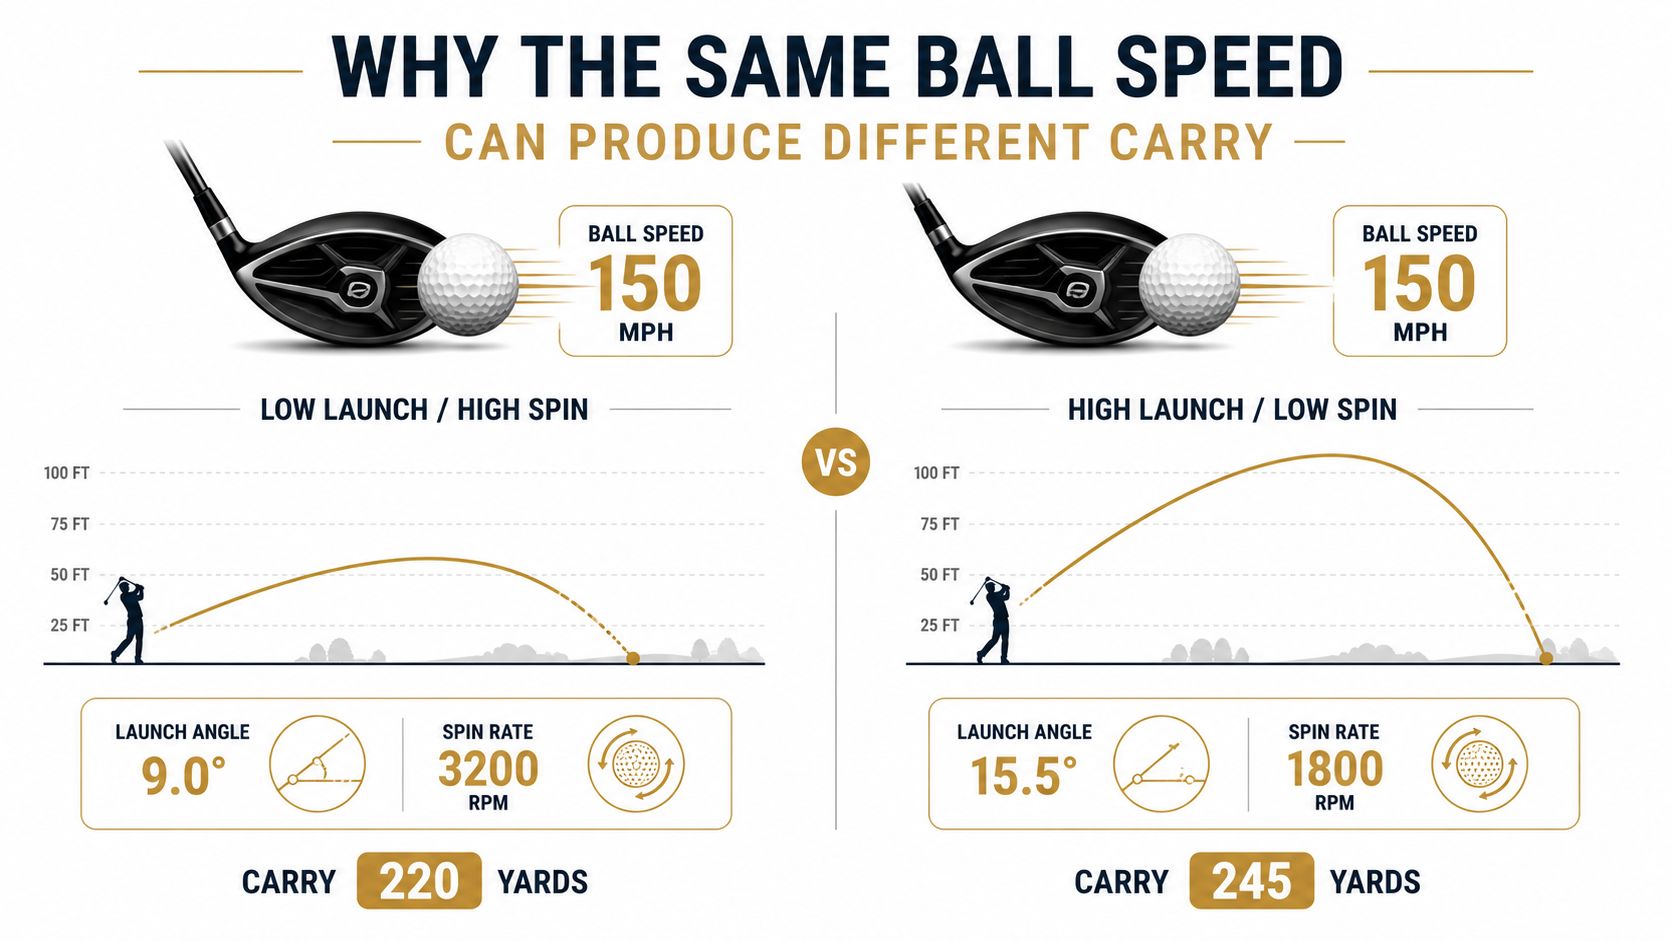
Two golfers can produce the same ball speed and still land in very different places downrange. The reason is launch and spin. A ball that launches too low or spins too much bleeds carry, while a ball that launches efficiently and spins in the right window keeps speed in the air longer. That's why a static lookup table can flatter one swing pattern and hide another.
The chart breaks down when the launch window breaks down
The fitting references used in modern launch-monitor work assume optimized launch around 11 to 14 degrees and spin around 2,100 to 2,700 rpm Golf Launch Lab fitting reference. If your ball speed is in the right range but your launch is low or your spin is high, the carry number falls short of the chart. That's not a mystery. It's the chart doing exactly what it should, under a different set of conditions.
That's why golfers often over-credit speed. They think they gained distance because the ball flew farther on one shot, when the actual change was a more efficient window. The same ball speed can look weak or strong depending on how the ball leaves the face. The chart only becomes honest when you include that context.
A simple diagnostic check
If a ball speed that should carry around 230 yards is only carrying 210, the likely issue is not pure speed. It's more likely strike quality, spin, or launch angle. The chart can tell you that immediately, because the expected carry ranges are built around efficient impact conditions Golf Launch Lab fitting reference.
Practical rule: when carry is short of the expected window, fix the window before trying to swing harder.
That distinction is what makes the chart useful for coaching. It doesn't just tell you whether the shot was long or short. It tells you where to look next.
Using Ball Speed to Inform Club Fitting
Ball speed should sit near the top of every fitting conversation because it tells you what the player is delivering to the ball. Lower-speed players usually need setups that help them launch the ball efficiently, while higher-speed players often need heads and shafts that keep launch and spin from drifting outside the efficient window. In both cases, the goal is the same, turn impact into carry as cleanly as possible.
What the fitter should check first
Start with the ball speed number, then layer in launch and spin. If the player is under-speeding the chart, the fitter needs to know whether the issue is contact, loft, or a shaft that isn't loading well. If ball speed is good but carry is poor, the answer is usually in the launch window rather than the raw number.
That's why ball speed is more useful than club speed alone. Club speed tells you how fast the head moved. Ball speed tells you whether the head and face interacted with the ball in a way that creates distance. A fitting session that skips ball speed is missing the metric that ties swing changes to the outcome you care about.
How equipment choices connect to the chart
For slower players, higher loft and lower-spin ball models can help the shot stay in the air longer. For faster players, lower loft and lower-spin setups can preserve efficiency without ballooning the flight. Shaft choice matters too, because a mismatch can reduce energy transfer and make the ball speed chart look better on paper than it plays on the course.
You can organize those decisions inside Dialed Golf's Golf Ball Fitter, especially if you're comparing setups across sessions instead of relying on memory. The value isn't just the number. It's the ability to compare how different clubs and balls affect the same ball-speed band.
If two heads produce the same ball speed, keep the one that delivers better launch and spin first, then worry about cosmetics.
Practice Priorities That Move the Ball Speed Number
A useful driver ball speed chart should lead to a practice plan, not a wish list. The midrange charts show that each 10 mph gain in ball speed can add roughly 15 to 25 yards of carry, which is why you need to identify the weakest link before you start chasing more speed TrackMan driver optimization document. The fastest improvement is rarely “swing harder.” It's usually fixing the part of the motion that's leaking efficiency.
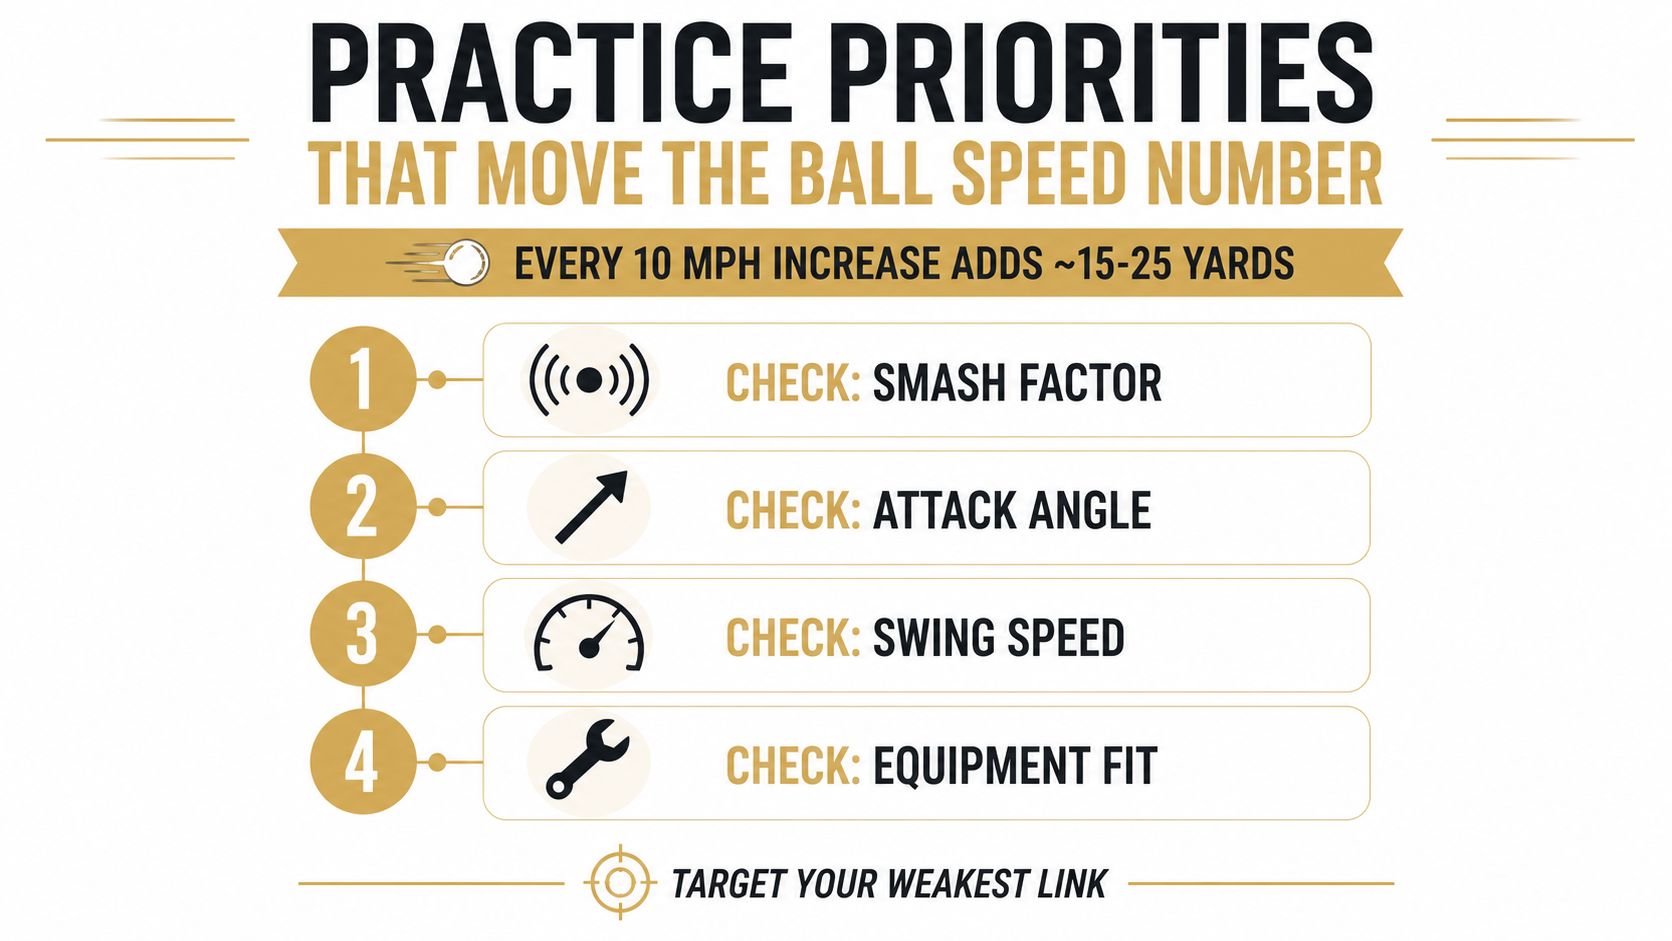
What to check in order
- Smash factor. If contact is weak, speed is being wasted before the ball leaves the face.
- Attack angle. If the swing is too steep or too shallow for your delivery pattern, launch efficiency suffers.
- Swing speed. Only after the strike is stable should you try to add raw speed.
- Equipment fit. A poor loft or shaft match can make a good swing look slow.
Those four items work because they map onto the causes of underperformance, not just the symptoms. A golfer with decent speed but poor strike quality can often gain more carry by cleaning up contact than by training for more clubhead speed. The chart helps you separate the two.
How to log sessions the right way
Track carry windows, dispersion, and start direction across a session, not just the best shot. The best ball speed of the day can hide the fact that the rest of the bucket was scattered. The number you want is the repeatable one, the speed you can trust on a normal swing.
Dialed Golf's automated session insights are built around that idea. They surface carry windows, dispersion, and start direction, then point to a single next practice priority. That makes the chart actionable instead of decorative.
Attack Angle and the Efficient Ball Speed Window
Ball speed only matters inside an efficient launch window. Published fitting references show that the ideal driver launch range changes with swing speed, roughly 10 to 17 degrees depending on how fast you swing and how the club is delivered PGA Magazine optimal launch-spin chart. That's the part most chart pages skip, even though it determines whether your ball speed turns into carry or just creates a prettier launch monitor number.
Why attack angle changes the outcome
Attack angle affects how the club adds or subtracts dynamic loft at impact. A positive attack angle can help a player use the same ball speed more efficiently, while a steeper or less efficient delivery can waste some of that speed in spin. The fitting chart linked above also shows carry can range from about 125 to 325 yards across different attack angles, which is a reminder that speed alone doesn't lock in the result PGA Magazine optimal launch-spin chart.
That range is why trying to squeeze out more ball speed can backfire. If the added speed pushes launch or spin outside your efficient window, carry can stall or even drop. The better move is to find the speed you can use well, then build from there.
What efficient looks like in practice
A player with a solid strike pattern and a workable launch window can make the chart come alive. A player with similar speed but an inefficient attack angle may see the same ball speed produce a much shorter flight. That's not a mystery of power, it's a fit and delivery problem.
The most useful question is not “How fast is it?” It's “How fast is it, and is that speed landing inside the window my swing can support?”
Turning the Chart Into a Personal Benchmark
The static chart becomes useful when you turn it into your own baseline. Dialed Golf's free tools let you build that reference from actual launch-monitor files, including CSV imports from Garmin, Rapsodo, SkyTrak, FlightScope, and Uneekor, so you can compare your real ball speed and carry against the benchmark ranges over time. The point is not to collect more numbers. It's to make the chart personal.
A practical workflow
Import a session, review ball speed, carry, and dispersion, then save the club data into a running history. From there, a carry chart generator can show whether your driver is living above or below the expected range for your speed band. That matters because one session can be misleading. A history shows whether the pattern is stable.
A workspace like Dialed Golf also keeps a club locker, gap detection, and shot history in the same place, which makes the chart part of a broader game-management loop. Instead of asking whether one drive matched a table, you can ask whether your driver is trending toward a more efficient band across multiple sessions.
What to compare over time
- Ball speed against carry. This tells you whether the number is converting properly.
- Carry against dispersion. This shows whether the speed gain is playable.
- Start direction against launch. This helps separate face issues from delivery issues.
Once those three line up, the chart stops being abstract. It becomes a reference you can improve against.
Frequently Asked Questions About Driver Ball Speed
What is a realistic driver ball speed for a beginner?
A beginner usually sits below the amateur average, but the exact number varies with contact and speed background. The useful benchmark is not a fixed “beginner” number. It's whether the player can keep ball speed and carry moving in the same direction over time.
How much ball speed is lost on off-center hits?
Off-center strikes reduce efficiency, which lowers smash factor and therefore ball speed. The amount varies by strike pattern, so the better question is whether your misses are consistent enough to show up in session averages.
Does swing speed or ball speed matter more for distance?
Ball speed matters more for the actual shot, because it's the result of how speed, strike quality, launch, and spin came together. Swing speed is still important, but it's the input, not the outcome.
How can I test ball speed without a launch monitor?
You can't measure it accurately without a launch monitor. If you don't have one, use carry and dispersion as rough proxies, then validate the ball speed later on a device that records it directly.
What should I do if my ball speed is good but my carry is short?
Check launch and spin first. If the ball speed matches the chart but the carry doesn't, the issue is usually the delivery window, not the raw speed.
Dialed Golf gives you a way to log launch-monitor sessions, compare your ball speed against real carry windows, and turn that data into a practice priority instead of a guess. If you want to build a personal benchmark from actual shots, import your files, review the patterns, and use Dialed Golf to connect your driver ball speed to the numbers that matter on the course.
[…] a deeper driver-only reference, the driver ball speed chart gives a cleaner entry point than a generic average. The key takeaway is simple, the right […]
[…] readers examining the ball side of the equation, the driver ball speed chart provides a useful companion concept. Ball speed helps show whether clubhead speed is being […]
[…] comparing their ball speed with a speed-based reference can also use this driver ball speed chart before judging whether a launch number is helping or […]
[…] multiple speeds and clubs rather than treating one driver number as the entire golfer profile. A driver ball-speed reference can help establish a baseline, but the final decision should include approach and short-game […]
[…] driver ball speed chart provides useful background on the relationship between speed and efficiency, rather than treating a […]
[…] same logic applies to driver analysis. A driver ball speed chart can help organize speed and distance information, but speed alone doesn't reveal where the […]