

A golf ball alone can change the distance calculation: in a 2025 test at 93 mph driver speed, the Callaway Chrome Tour averaged 210.8 yards of carry, while the shortest ball averaged 200.6 yards, a 10.2-yard, or 5.08%, difference, according to Today's Golfer. That wasn't a test at identical ball speed, but it exposes the weakness in treating swing effort as a fixed yardage.
A useful ball speed to carry distance chart starts with a reference band, not a promise. The fitter's job is to separate the speed produced at impact from the launch conditions, ball choice, and environment that determine what happens afterward.
Table of Contents
- Ball Speed to Carry Multipliers for Every Club
- The Physics Linking Ball Speed, Launch and Spin
- Launch Window Ranges Where the Same Speed Carries Differently
- How to Build a Personal Ball Speed Carry Chart
- Adjusting Carry for Temperature, Altitude and Wind
- How Strike Quality and Shot Shape Change Carry
- Using Carry Numbers for Gapping and Club Selection
- Decide Between a New Club and Better Launch
Ball Speed to Carry Multipliers for Every Club
The practical calculation is simple: carry in yards approximately equals ball speed in mph multiplied by a club-specific carry factor. The factor must come from an applicable reference or the golfer's measured shots, rather than from the club number alone.
The lookup below preserves a distinction that many charts hide. The numerical entries are illustrative calculation inputs, not established amateur averages; unmeasured entries stay open for a launch-monitor session.
Ball speed to carry multipliers by club
| Club | Typical ball speed | Typical carry |
|---|---|---|
| Driver | 150 mph illustrative reference | Measure neutral-condition carry; divide by ball speed for the multiplier |
| 3-wood | 140 mph illustrative reference | 200–215 yd example band; multiplier approximately 1.43–1.54 |
| 5-iron | Measure centered-strike median | Measure median carry and calculate carry ÷ ball speed |
| 7-iron | 110 mph worked example | Approximately 150–160 yd using illustrative multipliers of 1.36–1.45 |
| 9-iron | 100 mph illustrative reference | Fill from measured median carry |
| Pitching wedge | Measure the intended swing | Chart full and partial swings separately |
| Sand wedge | Measure the intended swing | 90–100 yd illustrative carry target; speed requires measurement |
For the hypothetical 7-iron, multiplying 110 mph by 1.36 produces about 150 yards. Multiplying the same speed by 1.45 produces about 160 yards. The arithmetic is valid, but neither multiplier becomes a fitting recommendation until the golfer's launch and carry support it.
For the hypothetical 3-wood, 200–215 yards divided by 140 mph gives approximately 1.43–1.54 yards per mph. This reverse calculation is often more useful than a published conversion because it starts with observed flight.
Use the multiplier as a diagnostic
A carry multiplier isn't an impact-efficiency measure. It describes the combined outcome of launch, spin, aerodynamics, and conditions after impact.
- Choose the correct shot: Compare centered strikes with the same club and intended trajectory.
- Calculate the observed factor: Divide measured carry by measured ball speed.
- Keep the context: Store the ball model and conditions alongside the result.
- Leave unsupported cells open: An empty measurement is more useful than a precise-looking guess.
A hybrid deserves its own row rather than an assumed iron equivalent. The 4-hybrid distance guide provides a useful starting point for evaluating that part of the bag.
Reference-band rule: A multiplier should describe a repeatable shot, not prescribe a distance the golfer must reach.
The Physics Linking Ball Speed, Launch and Spin
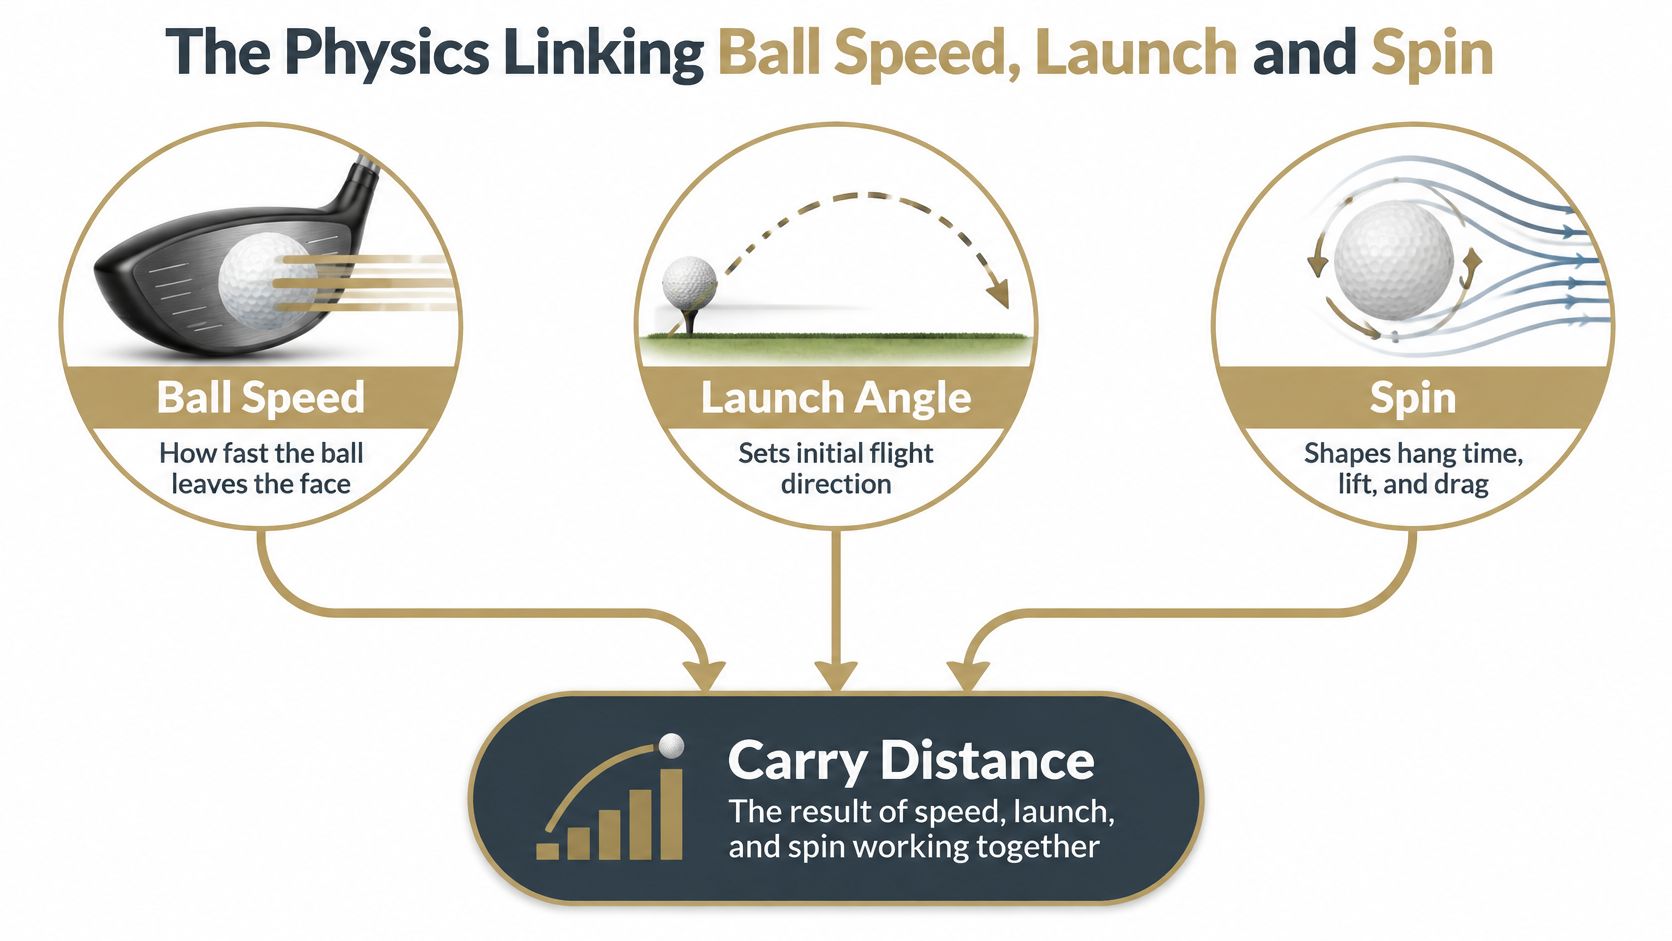
Ball speed describes how quickly the ball leaves the face. Launch angle sets its initial direction, and spin governs the lift and drag acting during flight. Carry results from how those initial conditions interact.
The USGA's Overall Distance Standard guidance describes testing at 120 mph clubhead speed, equivalent to approximately 176 mph ball speed, with 10 degrees of launch and 2,520 rpm of backspin, under a 317-yard total-distance limit plus a 3-yard tolerance, or 320 yards in practical conformity testing; it also records the standard's introduction in 1976 at 109 mph and the increase to 120 mph in 2004.
Those are prescribed equipment-testing conditions, and they say nothing about what an average golfer should expect on the course. The limit concerns total distance, including roll, not carry alone.
The interaction is best represented as connected inputs feeding one outcome, as the diagram below shows.
Each variable has a different job
- Ball speed: More speed increases distance potential when the other flight conditions remain suitable.
- Launch angle: Raising an excessively low launch toward an efficient window can increase carry; raising launch beyond that window adds nothing.
- Spin: Sufficient backspin supports flight, excessive spin adds drag, and insufficient spin combined with low launch shortens airborne travel.
The familiar description of a ball ballooning is useful only when the monitor supports it. A high flight is efficient when it converts speed into carry; a low flight is efficient when it does the same. The relevant question is what the trajectory produces downrange and how the ball behaves on landing, since apex height alone proves neither.
Separate speed gains from efficiency gains
A fitter should distinguish a faster ball from a better-launched ball. If speed increases but carry does not, the launch conditions have likely become less favorable. If carry increases without additional speed, launch efficiency improved.
That distinction changes the practice prescription. A golfer chasing speed needs physical or technical work on energy transfer, while a golfer already producing sufficient speed but launching poorly needs equipment or delivery changes. The same carry number can hide opposite causes.
The session record should therefore retain ball speed, launch angle, spin rate, and carry together. A distance-only view shows that something changed; a speed-only view shows that effort changed. Neither establishes which lever moved or whether the movement helped, and that gap is where bad fitting decisions start.
Launch Window Ranges Where the Same Speed Carries Differently
Why can a golfer match a chart's ball speed and still finish short? The chart may assume a flight the golfer isn't producing.
The Golf Launch Lab ball-speed guide describes reference charts built around roughly 11–14 degrees of driver launch and 2,100–2,700 rpm of spin. Those conditions describe an assumed window, not a universal fitting prescription.
Driver carry by ball speed and launch profile
| Driver ball speed | Neutral window | High launch, low spin |
|---|---|---|
| 140 mph illustrative test band | Establish measured baseline for this speed | Test a hypothetical +5 to +10 yd target with spin near 2,100 rpm; confirm actual carry |
| 150 mph illustrative test band | Establish measured baseline for this speed | Test a hypothetical +5 to +10 yd target with spin near 2,100 rpm; confirm actual carry |
| 160 mph illustrative test band | Establish measured baseline for this speed | Test a hypothetical +5 to +10 yd target with spin near 2,100 rpm; confirm actual carry |
The proposed yardage shifts are test hypotheses, not validated gains. Neither the speed labels nor the profile names establish an absolute carry distance without a flight model or measured shots.
Read profiles as comparisons, not rankings
For a golfer testing the middle row, the neutral window is the baseline produced during that session. The fitter then compares shots at similar speed with different launch and spin, rather than comparing an average shot with an unrelated best strike.
A low-launch, high-spin profile can waste distance potential by combining limited initial height with excessive aerodynamic resistance. It belongs in the comparison even though the table concentrates on the neutral and higher-launch alternatives.
A high-launch, low-spin profile can improve carry when it corrects an inefficient starting flight. It can also fail if spin becomes insufficient or the delivery change reduces strike quality. The profile's name doesn't establish that it is better.
Build the range from observed outcomes
The useful comparison records both typical carry and spread. A profile that produces a longer isolated shot but a wider carry distribution may be a poor choice for clearing a hazard.
- Hold speed comparable: Otherwise, a launch adjustment and a speed change become difficult to separate.
- Separate strike categories: A centered strike and a mishit shouldn't define the same reference window.
- Compare distributions: Median carry and dispersion reveal more than the longest result.
- Retain unsuccessful changes: A profile that shortens carry helps identify the golfer's practical limits.
Matching a chart's speed doesn't establish a swing-speed problem. A carry shortfall can be a launch-efficiency problem instead.
The strongest personal chart reports carry by launch profile, with a range for each observed pattern. That gives the golfer a usable explanation for distance differences instead of an unsupported target.
How to Build a Personal Ball Speed Carry Chart
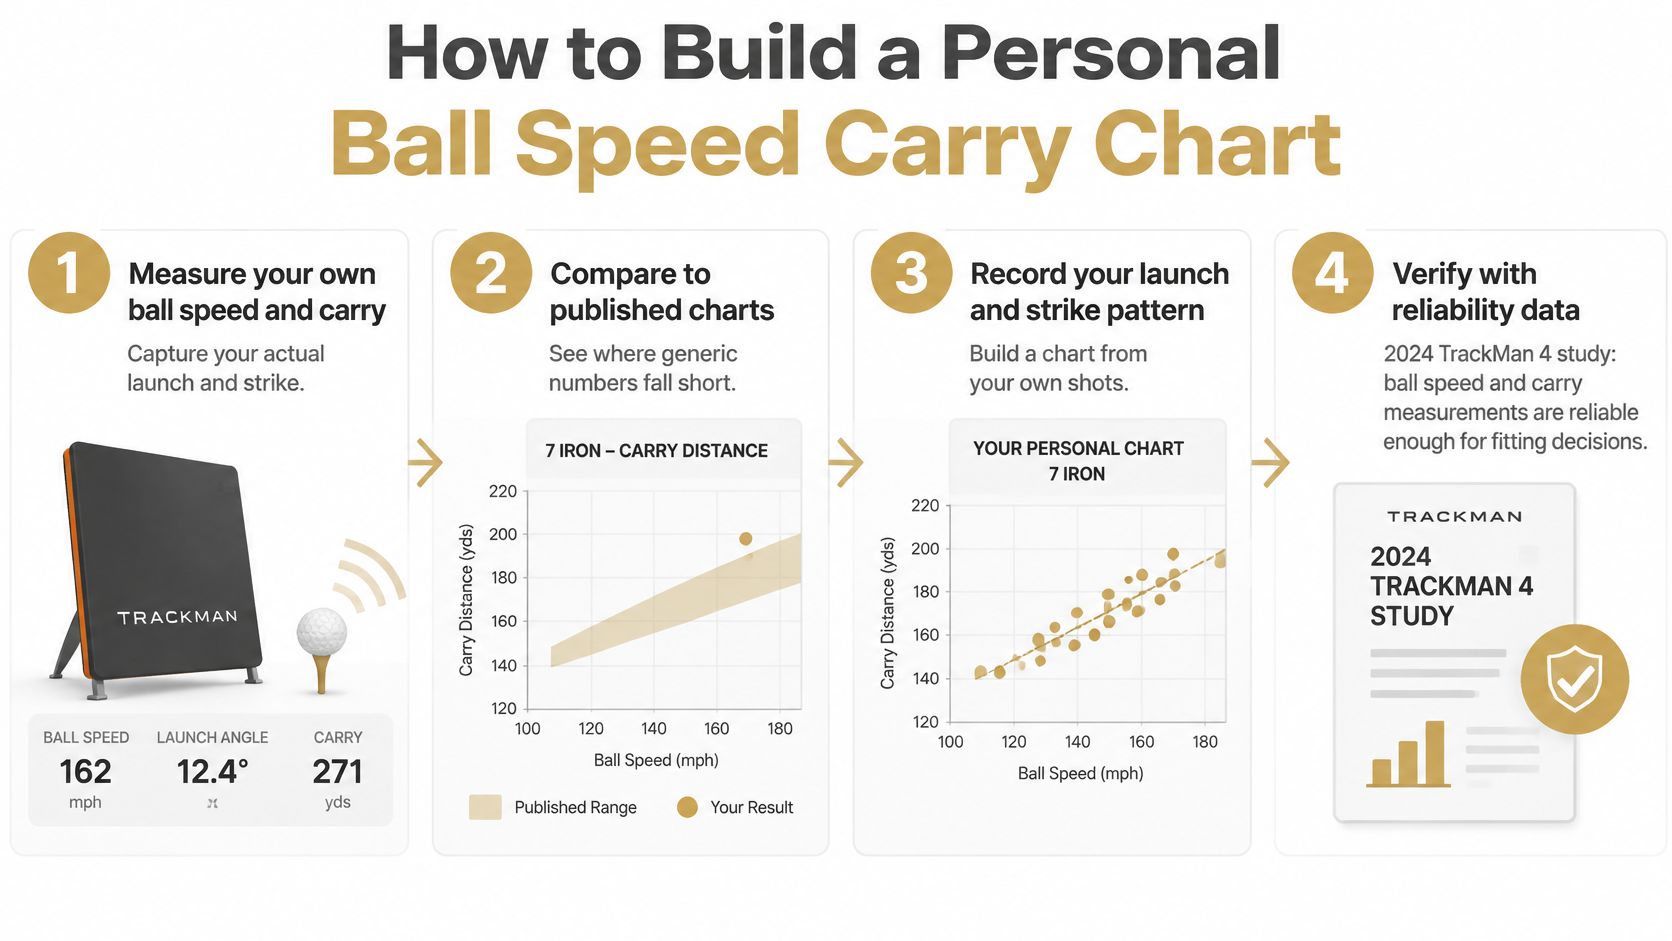
A personal chart captures the golfer's actual delivery rather than the delivery assumed by a published table. Ball speed remains the leading organizing variable, but it isn't interchangeable with clubhead speed: impact efficiency affects how much club speed becomes ball speed.
A 2024 peer-reviewed TrackMan 4 reliability study found a near-perfect ball-speed-to-carry association of r = 0.97–0.98, excellent ball-speed reliability of ICC = 0.97–0.99, and ball-speed standard error of measurement of 2.46–4.42 mph. That supports repeated measurement, while warning against treating a small displayed difference as definite improvement.
The process starts with the golfer's shots and ends with a repeatability check.
A practical collection protocol
The following sample sizes and grouping choices are a working protocol, not findings from the reliability study.
- Collect a consistent sample. A practical session can use 10–15 shots per club with the same ball model, hitting surface, and target. Keeping the setup consistent reduces avoidable differences between shots.
- Tag mishits and review outliers. Obvious mishits can be excluded from the centered-strike chart but should remain in a separate playable-shot record. That preserves realistic performance information without confusing it with clean-strike capability.
- Record medians rather than personal bests. Store median ball speed, carry, launch angle, and spin for each club. The median is less vulnerable to an unusually long or short observation.
- Group comparable speeds. An initial working choice is 5 mph bands, widened when the sample becomes too sparse. A group needs enough comparable shots to describe a pattern rather than an accident.
- Label the launch profile. Retain launch and spin beside each speed band. Otherwise, different trajectories can disappear inside the same summary.
- Repeat on a schedule. Monthly checks and checks after equipment changes provide a practical starting routine. Comparable repeat sessions help distinguish a lasting change from a favorable day.
Respect the units of uncertainty
The study's stated measurement error is in mph, not yards. It can't be applied directly as a carry-distance tolerance, and it isn't a universal specification for every personal monitor.
For gapping, the fitter should establish carry repeatability from the golfer's repeated sessions and the device's applicable measurement characteristics. Agreement between consecutive sessions is useful evidence, but the carry spread still matters.
A consistent setup is easier to maintain when equipment suits the practice location. The driving-range launch-monitor guide helps frame that choice around the environment where measurements will be collected.
Adjusting Carry for Temperature, Altitude and Wind
Environment can make a universal carry chart unreliable. The reference effects below, reported in Australian Golf Digest's guide to calculating yardages, illustrate why conditions belong in the session record.
Environmental effects on carry
| Condition | Typical effect on carry | Reference example |
|---|---|---|
| Altitude, 5,000 ft | About 6% more distance | Reported TrackMan estimate |
| Elevation | About 4.5 yd per 1,000 ft | Driver analysis |
| Temperature | About 2.5 yd per 10°F | Driver at 155 mph ball speed |
| Headwind, 15 mph | About 20 yd less | 140 yd shot |
| Tailwind, 15 mph | About 10 yd more | 140 yd shot |
| Humidity | Almost no effect compared with temperature | Reported analysis |
| Roll | No carry adjustment; estimate separately | Landing angle and ground firmness control the outcome |
These are reference effects with specific scopes, not interchangeable correction factors. The altitude examples shouldn't be added together, and the wind example shouldn't be scaled indiscriminately to every club.
Calibrate the practice location
A garage simulator, an exposed range, and a sheltered course hole don't necessarily produce comparable displayed distances. Some systems normalize flight, while outdoor measurements may reflect actual weather.
The record should identify which distance is being stored. Mixing normalized carry and actual-condition carry can create an apparent performance change without any change in the golfer's delivery.
Useful session tags include:
- Temperature and elevation: Record the playing environment, not merely the location name.
- Wind direction and strength: Distinguish headwind, tailwind, and crosswind relative to the shot.
- Ball status: Identify the ball model and whether a range ball was used.
- Surface and settings: Note the hitting surface and whether environmental normalization was active.
Comparisons should begin with the same club under the closest available conditions. Only then should the fitter estimate the residual environmental adjustment.
Keep airborne distance separate from roll
Headwind losses and tailwind gains aren't symmetrical. A golfer can't assume that a favorable wind cancels an equally strong unfavorable wind across different holes.
Humidity is a lower-priority adjustment than the larger influences identified in the reference examples. Recording it may be useful, but it shouldn't distract from wind direction or a substantial elevation change.
On-course application: Select the closest personal baseline, make a condition-specific carry adjustment, then evaluate landing and roll separately.
A firm fairway may extend total distance without helping the ball clear a bunker. A soft green may stop a shot quickly without changing its airborne distance. Club selection needs both the carry requirement and the expected landing outcome.
How Strike Quality and Shot Shape Change Carry
Equal ball speed doesn't guarantee equal carry, and similar speed doesn't establish that a draw must travel farther than a fade. Shot shape is an outcome of delivery and spin conditions, not a distance ranking.
In a 2024 long-drive case study, straight shots averaged 189.3 mph ball speed and 329.7 yards of carry, draws averaged 192.1 mph and 301.8 yards, and fades averaged 193.3 mph and 345.7 yards, according to the Journal of Human Sport and Exercise. This was an elite long-drive case study, not a population benchmark or a universal rule for amateur shot shapes.
The fade carried farthest in that case despite the draw producing similar speed. The comparison establishes that speed alone didn't explain the outcomes; it doesn't isolate spin axis as the sole cause.
Separate contact from curvature
A fitter should record strike location independently of the intended shot shape. A golfer attempting a draw may deliver centered contact on one shot and a toe strike on the next, creating different launch conditions despite the same intention.
Off-center contact can reduce ball speed and alter spin. However, toe and heel strikes don't universally raise backspin: the direction of change depends on contact location, club characteristics, and delivery.
That distinction prevents a misleading diagnosis. A lower carry-to-speed factor may reflect unsuitable flight, while a shorter shot with proportionally lower speed may primarily reflect lost impact efficiency.
- Centered-strike record: Describes the club's clean-contact flight.
- Playable-shot record: Includes the misses the golfer takes onto the course.
- Shape-specific record: Separates repeatable draw, straight, and fade patterns when sufficient observations exist.
A fitter needs all of these views. Removing every miss may clarify equipment potential, but it can exaggerate the golfer's reliable hazard-clearing distance.
Treat the ball as part of the setup
The ball-model comparison in the opening illustrates another controlled variable. A chart collected with one ball shouldn't automatically govern decisions made with another.
A fixed clubhead-speed test also isn't proof of equal ball speed across models. Ball speed, launch, and spin must remain visible before attributing a distance difference to a single mechanism.
A practical ball comparison alternates models under the same setup and records carry, flight, and dispersion. If an apparent bag gap appears after a ball change, the fitter should investigate that change before adjusting club lofts.
The useful question isn't whether a draw or a particular ball is longer in general. It is which combination gives that golfer a repeatable carry window and suitable landing behavior.
Using Carry Numbers for Gapping and Club Selection
Consider a hypothetical set in which the 7-iron carries 150 yards, the 8-iron 138 yards, and the 9-iron 126 yards. The arithmetic gives even 12-yard steps, but an evenly spaced chart is only useful if the golfer can reproduce those distances.
The next check is the carry distribution. A club with a tidy median but a broad spread may overlap its neighbors on the course even when its chart entry looks distinct.
Diagnose overlaps and holes
As practical screening thresholds rather than universal fitting standards:
- Possible overlap: Clubs within 5 yards of median carry deserve comparison for trajectory, dispersion, and distinct playing roles.
- Possible hole: A step greater than 20 yards deserves a test of another club, a partial swing, or an alternative trajectory.
- Unstable gap: A separation that disappears between sessions needs further measurement before an equipment change.
The golf gap-analysis guide provides a framework for organizing those checks. The purpose isn't to force identical spacing throughout the bag, but to ensure that each club supports a useful shot.
Match the decision to the club group
For driver and fairway woods, compare launch profiles and usable landing conditions. A longer median isn't automatically better if the resulting shot can't hold the intended landing area.
For long irons, inspect performance in the conditions where the club will be used. A gap measured in sheltered practice may not describe a wind-exposed approach.
For wedges, keep intended swing length and strike category explicit. A partial scoring shot shouldn't share a row with an unrestricted full swing merely because both use the same club.
Choose a club for the task
Hazard clearance depends on the conservative end of the usable carry distribution, not the longest recorded shot. An approach to a shallow green also requires attention to landing behavior and dispersion.
A club can justify its place without producing a distinct full-swing carry. A lower flight, safer tee option, or more controllable partial shot may supply a role that median spacing doesn't capture.
Distances, recommendations, maps, calculations, and analytics are informational estimates, not guarantees of performance. Before purchasing equipment, the golfer should establish whether the missing yardage is repeatable, condition-specific, or associated with a particular strike pattern.
Decide Between a New Club and Better Launch
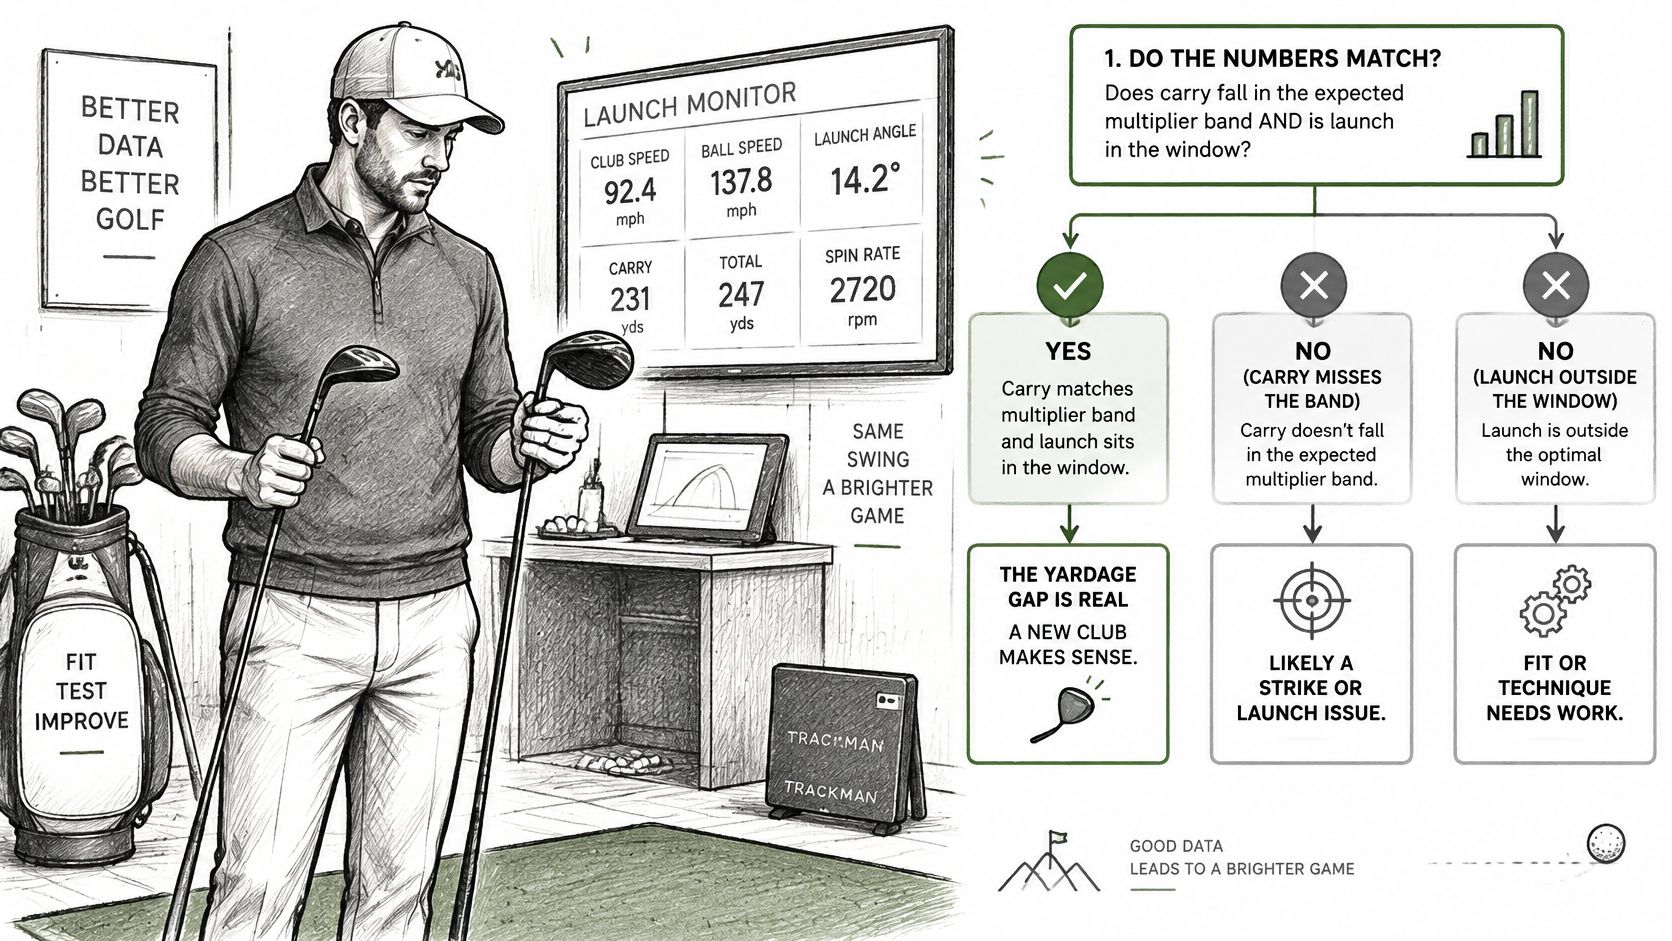
A purchase decision should follow a three-branch check rather than a disappointing shot.
- A genuine equipment gap: Carry fits the golfer's established reference band, launch is suitable, and the missing shot remains. A different club merits a fitting test.
- An inefficient flight: Carry falls below the golfer's demonstrated capability while launch or spin changes unfavorably. Delivery and setup deserve attention before a purchase.
- A condition-specific shortfall: The distance loss appears only under particular weather or elevation conditions. The yardage adjustment should change before the bag does.
A launch-monitor evaluation should connect each branch to repeated shots rather than a single result.
Keep the evidence in one golfer record
Separating the three branches takes sessions that are comparable. Carry recorded alongside ball model, launch, spin, and conditions lets the golfer tell a repeatable gap from one tied to weather, elevation, or a particular strike. A record that mixes balls, setups, and swing intents without labels produces numbers that cannot answer the question.
Dialed Golf keeps launch-monitor sessions in one golfer record. Golfers add the clubs they play to their locker, pair a monitor with the macOS or Windows app at the range, or import a session afterward. Live pairing is desktop-first, and import sources include Garmin, Rapsodo, SkyTrak, FlightScope, Uneekor, GSPro, Awesome Golf, and more.
Make the next test decisive
A fitting test should put the candidate club and the incumbent in the same session, on the same ball model, with enough shots to compare medians rather than highlights. If the candidate's median carry fills the missing yardage while launch, spin, and dispersion stay inside the golfer's usable window, the equipment case is real. If the incumbent already produces that flight on its better strikes, the cheaper fix is delivery, not hardware.
The margin for error is the golfer's own strike scatter. A new club that wins only on its best ball has won a single swing, not solved the gap.
The accompanying video provides another visual reference for evaluating the decision.
The strongest buying case is a persistent, measurable need. Better launch is the stronger answer when the existing club already demonstrates the required flight under repeatable conditions.
Dialed Golf offers free chart-building tools and one golfer record for turning launch-monitor sessions into usable carry references. Golfers can visit Dialed Golf, build a printable carry chart, and use recorded sessions to decide whether a yardage gap needs another club or better launch.