

You've got the Garmin R10 plugged in, a pile of CSVs on your laptop, and a nagging feeling that your 52, 56, and 60 are all doing the same job. Or maybe the opposite, one club leaves a dead zone in the exact yardage you keep facing on the course, and you can't tell whether that's a real gap, a bad session, or just one ugly range day.
That's where a gap analysis stops being a business term and becomes a practical golf tool. Done well, it gives you a current state, a future state, and a clearly named gap type, so you can stop guessing and start fixing the right thing. In launch-monitor terms, that means sorting out whether you have a true yardage hole, overlapping clubs, a data problem, or a bag setup that doesn't match the shots you hit.
Table of Contents
- Why Your Bag Has Gaps You Can't See
- What a Gap Analysis Measures
- Preparing Your Launch Monitor Data
- Calculating Carry Windows From Real Shots
- Finding Overlaps and Holes in Your Bag
- Turning Gaps Into One Practice Priority
- Building a Printable Carry Chart and Re-Test Plan
Why Your Bag Has Gaps You Can't See
A lot of golfers assume the bag is already spaced out because it has fourteen clubs and the lofts look sensible on paper. In practice, the range data tells a messier story. Two wedges can land in nearly the same carry window, and the space between the longest iron and the shortest wood can be wider than you expected.
That's why intuition breaks down. A club can feel useful because you like the look of it, not because it covers a unique yardage. Another club can feel “off” only because your session was too noisy to show what it really does.
The real problem is usually hidden in the session data
A launch monitor doesn't care what you intended. It records what the ball did, and that often exposes overlaps, holes, or fake precision created by one good strike. If you've ever looked at a CSV and thought, “I know this bag is fine, but I can't prove it,” you're already in the right mindset.
The useful outcome isn't a vague verdict like “wedge gapping looks okay.” It's a printable carry chart, a short list of genuine gaps, and one practice priority that tells you what to work on next. That's the kind of output that turns a folder of range sessions into a decision.
Practical rule: if you can't point to a yardage window with a baseline and a target, you don't have a gap analysis yet. You have a pile of shot notes.
The rest of the process is just discipline. Measure the current state, define the future state, label the gap type, and then make one decision that changes what you do at the range.
What a Gap Analysis Measures
In golf, a gap analysis is a yardage check, plain and simple. It measures the space between the carry windows of two consecutive clubs. A carry window is the range your shots land in, not the one number you hope for on the cleanest strike.
Start with the current state and future state
The strategic version of gap analysis from ClearPoint Strategy's guide starts with current state, future state, and the gap itself. The current state needs a defended metric tied to a date, the future state needs a target and deadline, and the gap needs to be labeled as a performance, tracking, definition, or strategy problem, with a closing plan built around one owner, one action, and one check-in date (ClearPoint Strategy's gap analysis template).
That framework carries over cleanly to launch-monitor work. Your current state is the measured carry pattern for each club, the future state is the yardage coverage you want, and the gap is the space between those two points. What changes next depends on the type of problem, not just how big the distance looks.
The four gap types change the fix
A performance gap means the club is not producing the window you want. A tracking gap means you do not have enough clean shots to trust the number. A definition gap means the target club or yardage has not been defined well enough. A strategy gap means the bag itself does not match the shots you face.
A gap analysis only helps when it tells you whether the problem is the swing, the data, the target, or the bag.
That distinction matters because each one leads to a different response. A performance gap might call for a swing change or a different club. A tracking gap just needs cleaner data. A definition gap needs a better target. A strategy gap means the bag needs to be rebuilt around real shot needs, not assumptions.
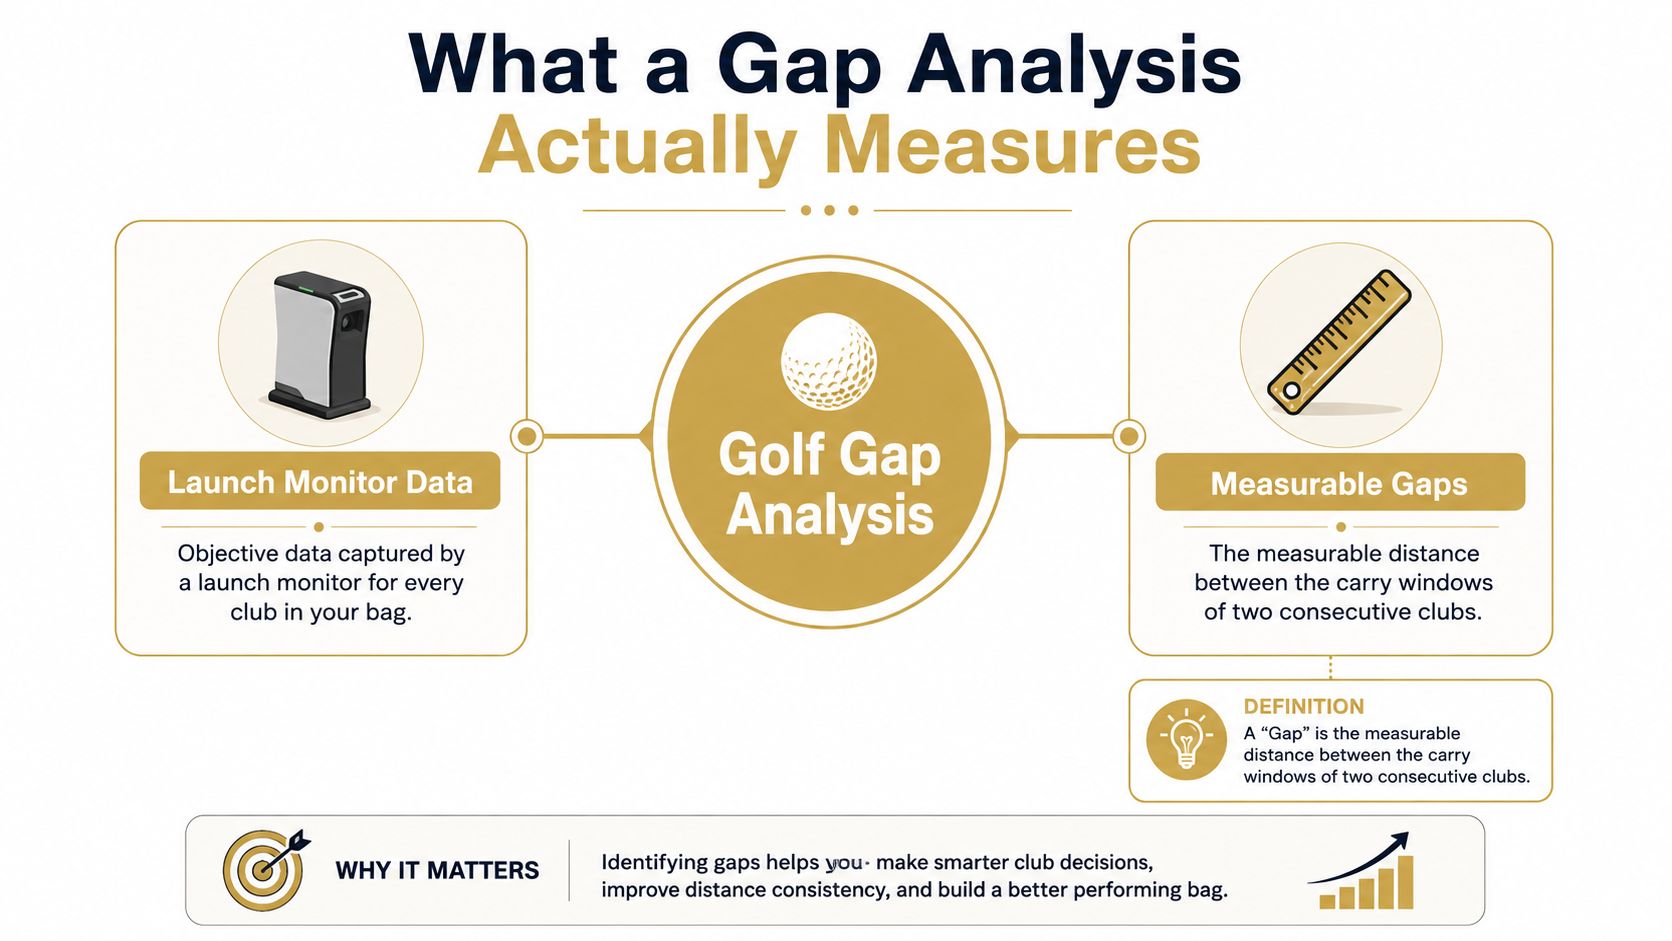
Read a carry chart this way and the focus shifts from a single number to coverage. That is the point. A good chart shows where the windows stack cleanly, where they overlap, and where the bag leaves you stranded.
Preparing Your Launch Monitor Data
Hidden in the session data is usually the actual problem. If the round includes shanks, fat shots, topped balls, and random partial swings, your carry windows will be noisy enough to send you toward the wrong fix. The goal is not to make the chart look tidy, it is to make it reliable enough to trust.
Build a session that can be defended
A good gapping session starts with enough stock swings to describe the club, not one strike you remember. I want clean contact, similar intent, and consistent labels from session to session so a 7-iron today means the same 7-iron next month. Change balls, settings, or club names every time, and the analysis stops being comparable.
The workflow is straightforward. Import the CSV export from your device, clean the obvious mishits, and normalize club names so the same club always lands in the same bucket. Dialed Golf's desktop workflow does that with CSV imports from devices such as Garmin R10, Rapsodo, SkyTrak, FlightScope, and Uneekor, then organizes the shots into a single locker with carry, total, ball speed, spin, launch, and club speed.
Use the data you can trust
Launch-monitor numbers only help when the session conditions are close enough to each other that the club, not the environment, is driving the result. That means no casual mixing of range balls and premium balls in the same chart if you want a clean comparison. It also means being ruthless about excluding obvious mis-hits before you calculate anything.
Here's the checklist I use before I trust a gap session:
- Shot quality first: remove fat shots, shanks, topped balls, and any swing you would never use to define a club.
- Club labels second: keep naming consistent across sessions so trends compare cleanly.
- Device export third: map the CSV fields into one format before you start reading carry windows.
- Intent fourth: treat stock shots as stock shots, not pressure swings or hero cuts.
Practical rule: if the session has too much “I was trying something” in it, the chart is no longer a gap analysis. It is a swing diary.
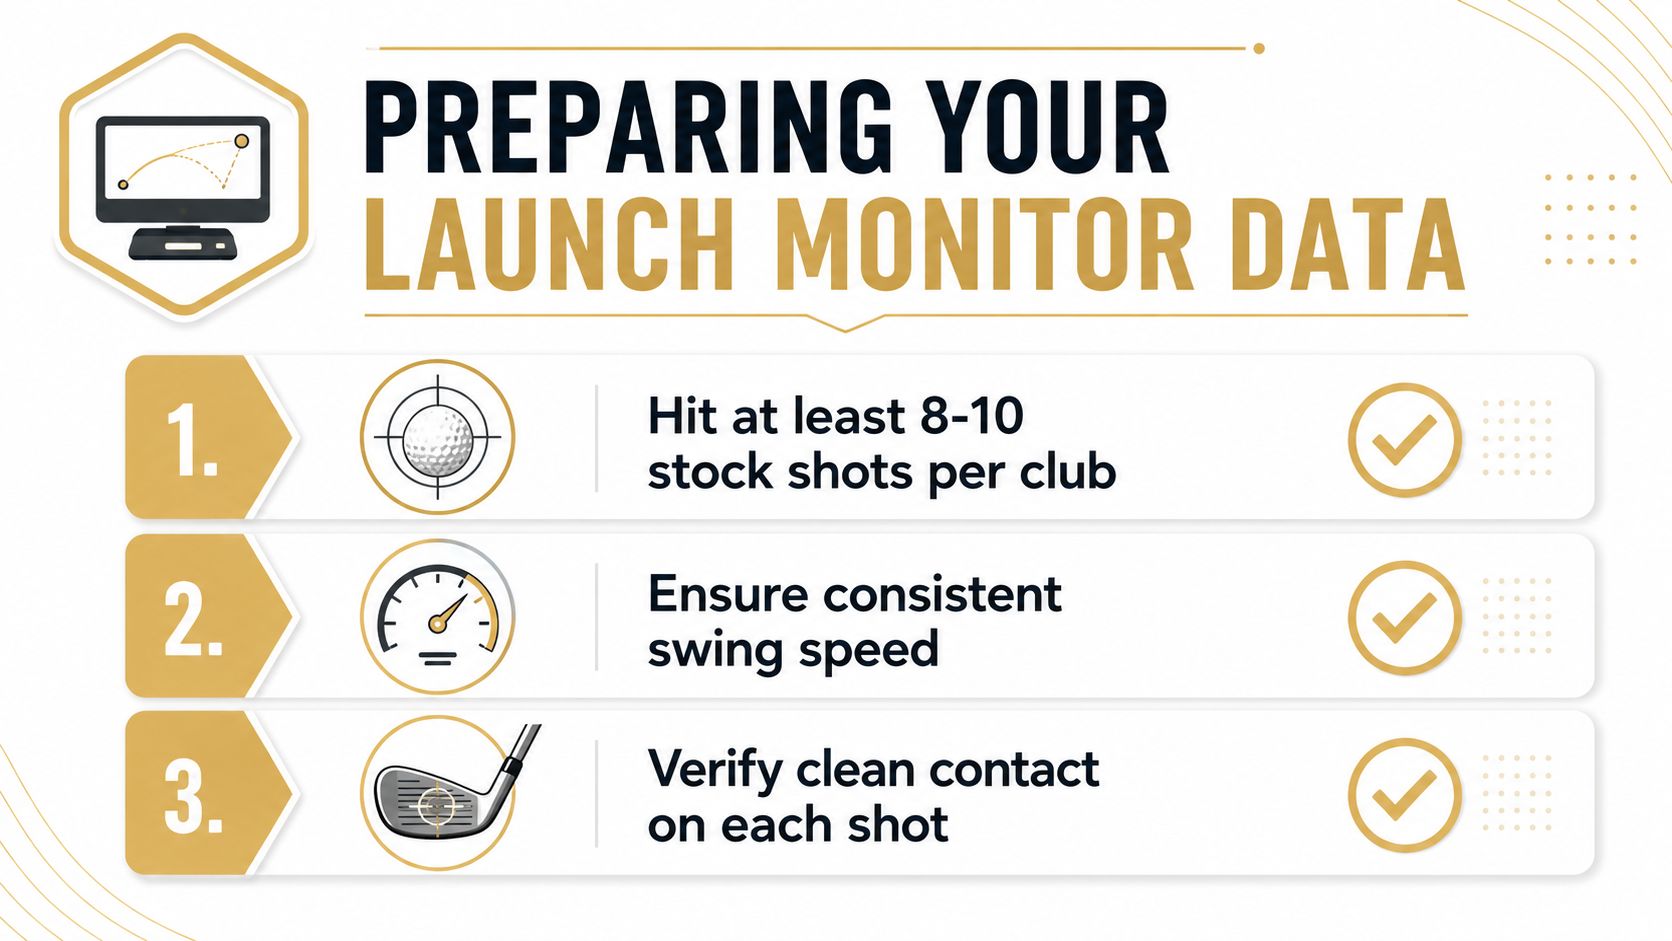
The point is simple. Clean sessions make honest charts, and honest charts make better decisions.
Calculating Carry Windows From Real Shots
The analytical core is not the average carry. It's the median, because one bad swing can drag the mean around and make the club look better or worse than it really is. Once the median is set, you bracket it with a spread measure such as standard deviation or a 10th-to-90th band so you can see where the club reliably lands.
Read the window, not the best shot
A lot of golfers secretly build their gapping around their best strike. That feels satisfying and leads to bad planning. One flush wedge that flies a number doesn't tell you where the club lives most of the time.
Here's the safer way to think about it. If you have a small sample of clean shots, use the middle of the data and a band around it. Then compare that band to the next club up or down. The overlap or hole between those bands is what matters.
| Club | Median carry (yds) | 10th-90th band (yds) | Window width (yds) |
|---|---|---|---|
| 56° wedge | 78 | 71-84 | 13 |
| 52° wedge | 93 | 86-101 | 15 |
| 60° wedge | 58 | 48-67 | 19 |
In a wedge session like this, the 52° and 56° bands overlap enough that they may be covering the same yardage job. The 60° sits in a different part of the chart, but if your course demands a reliable number in the low-60s, you'd want to check whether the window supports that shot or just appears to on one good swing.
Why sample size changes the meaning
Two sessions of eight clean shots can tell you something useful. One beautiful strike followed by seven junk swings tells you almost nothing. The reason is simple, the chart reflects what your swing tends to do, not what it can do once.
Practical rule: one great shot is not a distance profile. It's a highlight.
A carry chart built from real shots should look like a stack of bands, not a row of single points. When you read it that way, you can see which club fills which job, and which club is pretending to do work it doesn't really cover.
Finding Overlaps and Holes in Your Bag
Once the carry windows are drawn, the next step is comparison. If two clubs live in the same yardage neighborhood, one of them is probably redundant. If there's a dead zone between clubs that you can't cover without forcing a swing, that's a real hole.
Classify each interval between clubs
I use three labels. Overlap means two clubs are covering the same job. Gap means a yardage is uncovered by any club's window. Healthy stack means the windows step through the bag cleanly without crowding each other or leaving a dead zone.
There's a useful practical threshold here. If two clubs overlap by a large chunk of either window, they're not earning separate spots. If the space between one club's top end and the next club's bottom end is wide enough that you're guessing, that's a hole worth respecting.
The trick is to decide whether the problem is the club, the swing, or the sample. That's where dispersion and start direction help. If carry is messy but launch and start line are stable, the club may be the issue. If everything is wandering, the swing is probably the bigger problem. If the sample is thin, wait.
A simple way to audit the bag
- Draw the windows. Put every club on one carry chart.
- Mark the intervals. Note where bands collide or separate.
- Ask what changed. Look at dispersion and start direction before changing equipment.
- Decide the fix. Club change, swing work, or more data.
The Golf Bag Gap Analyzer is built for exactly this sort of comparison, especially when you want to spot overlaps and missing yardages without manually rebuilding every chart.
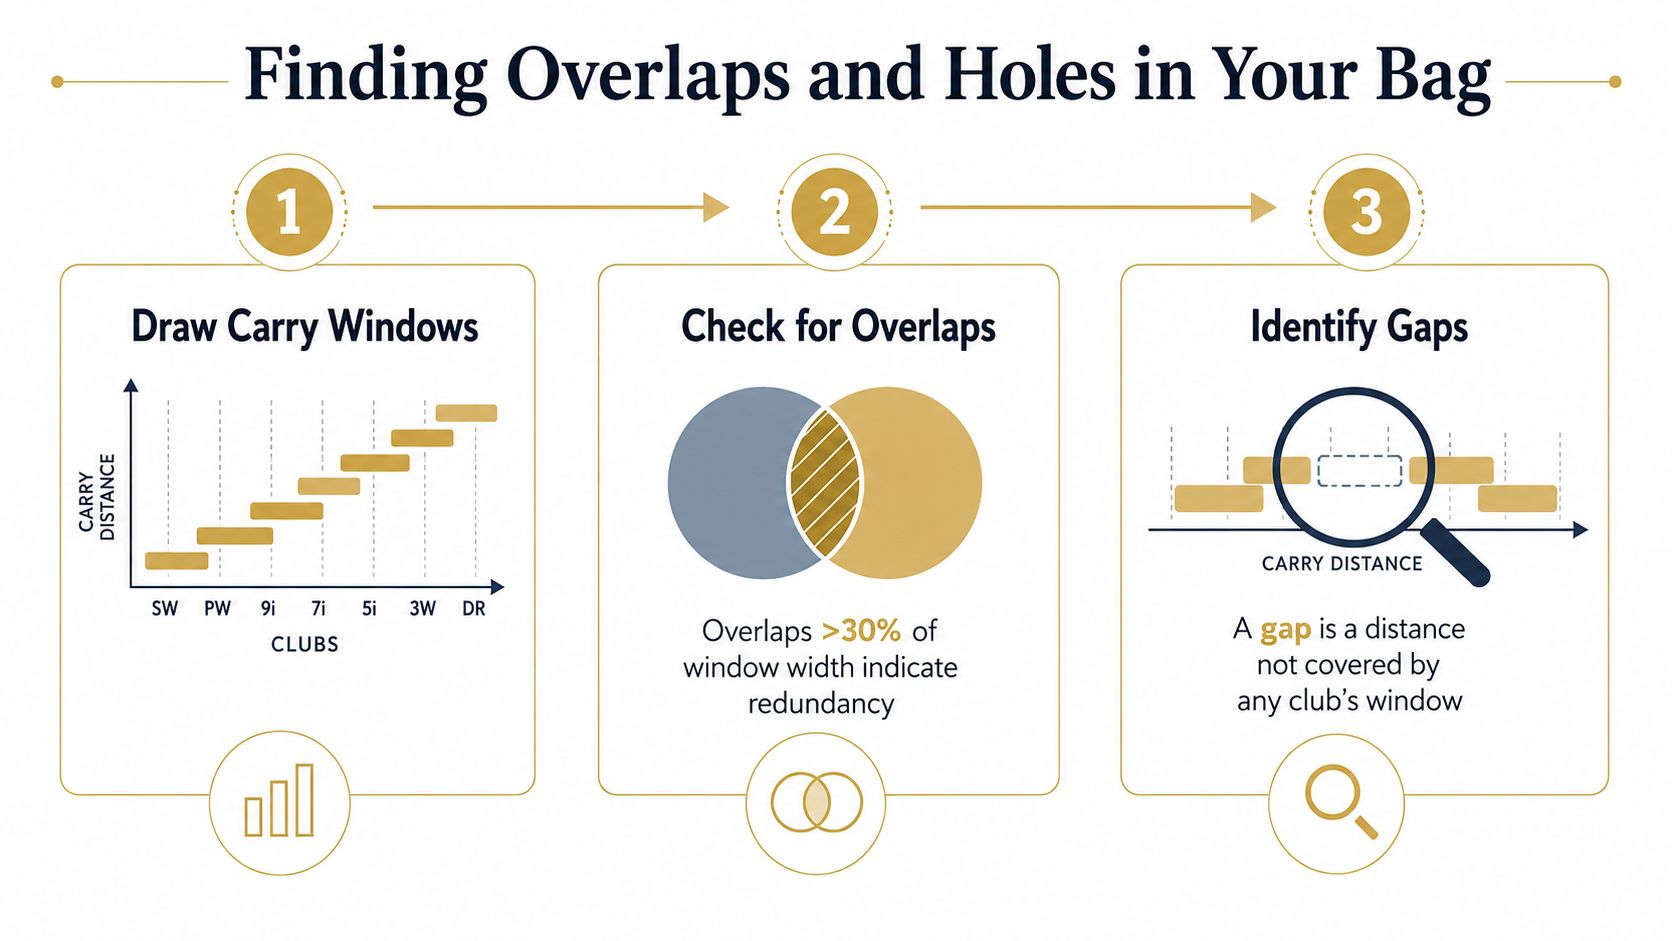
If you've got a club that overlaps its neighbor and another club that leaves a dead zone, don't treat that as one vague issue. Separate the two. One is redundancy, the other is coverage.
Turning Gaps Into One Practice Priority
The fastest way to ruin a good analysis is to turn it into six priorities. Tighten the 7-iron. Learn the 60°. Fix the wedge overlap. Hit fades better. That list feels productive, but it scatters your work and makes it hard to tell whether anything improved.
Pick the gap that deserves the next session
A closing plan only works when it has one owner, one action, and one check-in date. In launch-monitor work, that means choosing one carry window, one overlap, or one sample problem to address before you touch anything else. If the gap is really a club-fitting issue, you might need a loft change or a different head. If the pattern is coming from delivery, the fix belongs in the swing. If the sample is thin or noisy, the priority is more honest data, not a swing rebuild.
I pay closest attention to the shortest path between the current state and the future state. If one club is producing a messy window while the neighboring club is clean, that is usually where the next session should go. If both clubs are inconsistent, the bigger problem is probably the swing or the way the session was collected. That kind of call matters because a short Garmin R10 session can make a bad look real, or make a real hole look smaller than it is.
Here's a simple way to write the next priority:
- Priority: the single gap or overlap you are working on.
- Evidence: the carry window, dispersion pattern, or start-direction pattern that shows why it matters.
- Action: one drill, one club change, or one re-test.
- Date: when you will check the result again.
Dialed Golf's output points you toward a single next practice priority, which is the right level of focus for this work. The Wedge Distance Matrix is useful here when the scoring clubs need a cleaner plan and the carry numbers have to turn into something you can use on the course.
After you choose the priority, stick with it for the session and ignore the rest.
A good wedge plan depends on knowing which loft fills which window without crowding the next one. Once that is clear, the practice work stops feeling vague and starts matching the gap you found.
Building a Printable Carry Chart and Re-Test Plan
A gap analysis only matters if you can use it again. Print the carry chart, keep it in your bag or on your phone, and treat it as the baseline for the next pass. The goal is active use, not chart admiration. You want a clean way to compare the next session with the last one without rebuilding the whole sheet each time.
Make the chart travel with you
Keep the chart in a format you can open fast and read without squinting. Put the baseline clubs, the carry windows, and the single practice priority in one place, then bring that same reference to the range every time. That keeps the comparison honest and stops you from changing the frame after a bad session.
The Carry Distance Chart gives you a printable reference point for the clubs you trust. It works well when the next range session needs to confirm whether a gap is closing or whether the last result was just a short-session artifact. Re-test after equipment changes, after a real swing adjustment, or whenever the bag feels different from the numbers on paper.
Watch the traps that distort the next pass
Short samples can make a hole look larger or smaller than it really is. Wind, temperature, and range balls can shift carry enough to create false confidence, especially if the session only has a few usable swings. Compare like with like whenever you can, because a clean baseline is worth more than a noisy one.
A simple four-step loop keeps the process grounded:
- Prepare the data. Clean sessions and consistent club labels.
- Calculate the windows. Use the actual shot distribution, not a wishful number.
- Classify the intervals. Overlap, hole, or healthy stack.
- Pick one priority. Work the clearest fix, then re-test.
Keep that loop tight and the chart stays a working tool, not a one-time spreadsheet. That is the practical side of how to do a gap analysis in golf, a chart that shows where the bag is solid, where it has problems, and what to do next.
If you want a cleaner way to turn launch-monitor shots into a decision, visit Dialed Golf. It organizes your sessions, surfaces carry windows and dispersion, and gives you the kind of gap analysis that turns scattered CSVs into one next practice priority.
[…] clubs reviewing where these paths still rely on duplicate entry or informal handoffs, a gap analysis framework can help identify the control points that need clearer […]
[…] For a deeper process on identifying the spaces between clubs, use this guide to golf gap analysis. […]
[…] golfers doing a bag audit, that usually starts with a proper gap analysis workflow. For coaches, it means assigning the same drill block each week so sessions stay comparable. For […]
[…] gap analysis guide explains how to turn those measurements into a bag-level view instead of a list of isolated club […]
[…] gap analysis for golf practice can help expose the difference between what a player enjoys practicing and what costs strokes. The […]