

You're standing over a driver you just hit well. The launch monitor flashes back one clean number, ball speed, and for a second it feels like the whole shot should make sense now. Then the confusion hits, because that number is satisfying, but it still doesn't tell the full story unless it gets tied to your swing, your strike, and the club in your hands.
That's the trap with average golf ball speed. People see one mph figure, compare it to a Tour player, and either feel great or feel behind. The better move is to treat that number like a starting point, then read it alongside the rest of the shot data so it says something useful about distance and fit.
Table of Contents
- The Moment Your Launch Monitor Spits Out a Number
- What Ball Speed Actually Measures
- Tour and Amateur Benchmarks You Can Compare Yourself To
- How Swing Speed and Smash Factor Produce Ball Speed
- Ball Speed by Club and How It Drives Distance
- Where Ball Speed Comes From on Different Launch Monitors
- Turning Ball Speed Into a Trend Worth Tracking
The Moment Your Launch Monitor Spits Out a Number
You catch one flush drive and the screen lights up with a ball speed number that looks fast enough to brag about, or maybe annoyingly modest for how solid the strike felt. That's the exact moment most golfers start asking the wrong question. They ask, “Is this good?” when the better question is, “Good for what club, what swing, and what kind of player?”
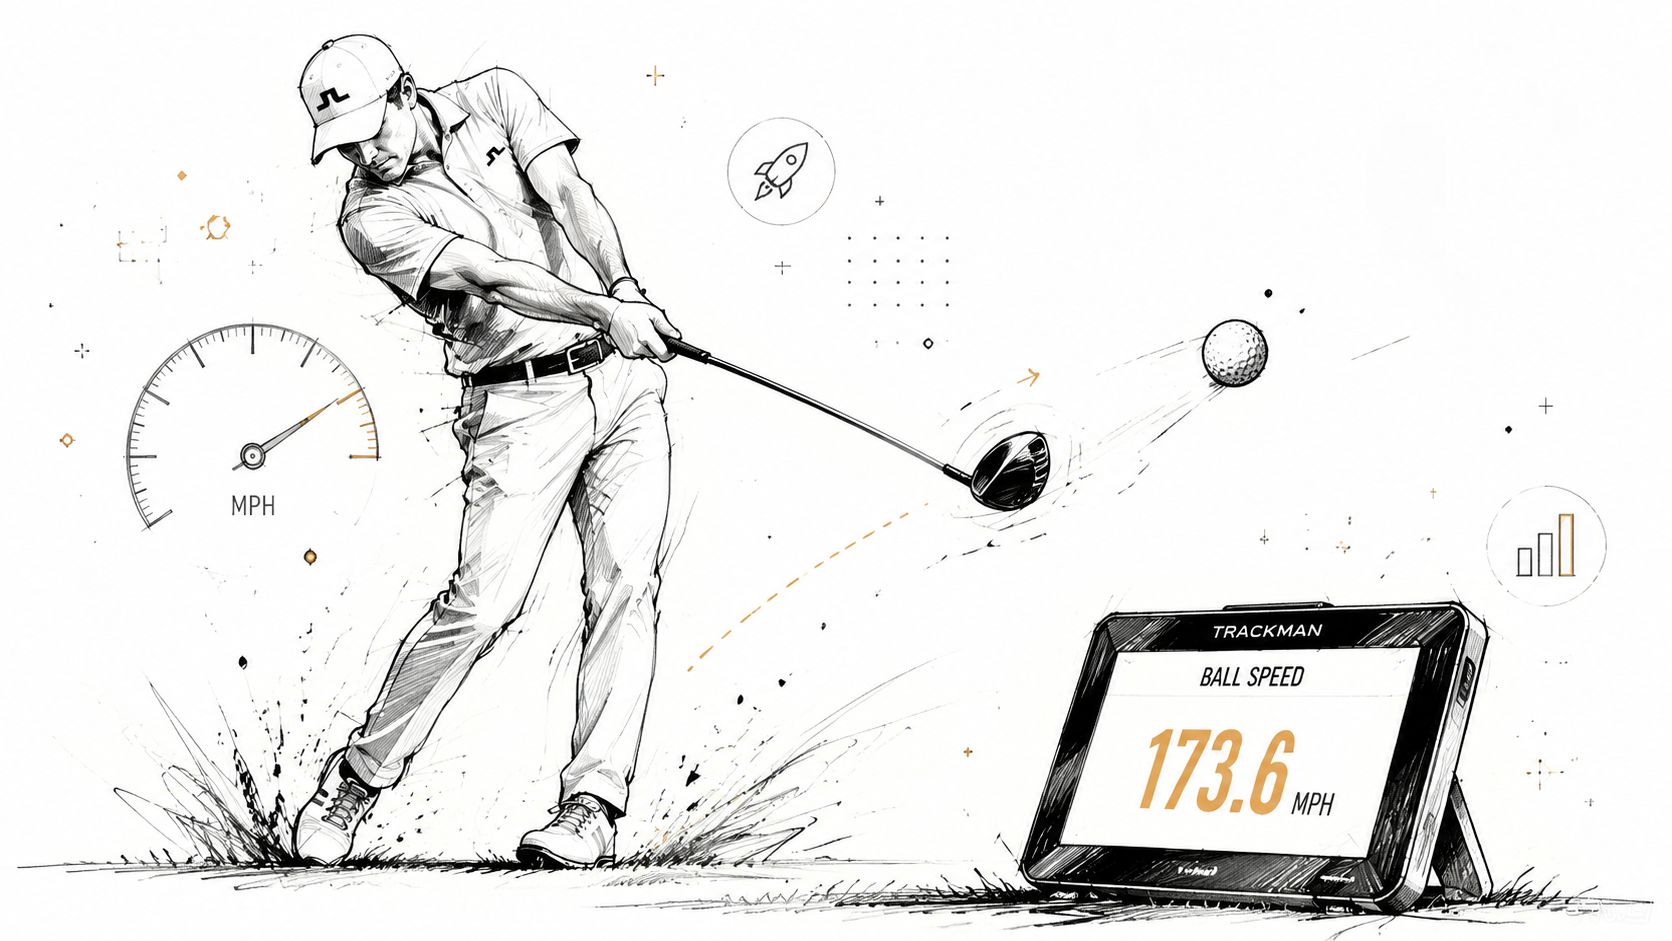
A single number can feel authoritative, especially after a flush strike, but ball speed only becomes meaningful when it has context. A driver number compared with a wedge number is almost useless, and a recreational golfer compared directly with a PGA Tour average is usually comparing two different worlds. TrackMan's benchmark for an average male amateur driver ball speed sits around 133 mph, while PGA Tour driver speed is around 167 to 171 mph and LPGA Tour driver speed is around 140 to 143 mph TrackMan benchmark data.
That gap matters less as a scoreboard and more as a clue. If a golfer is chasing better distance, the number on the screen is really telling a story about strike quality, launch conditions, and where that player sits relative to their peer group. The same shot that looks average on a tour chart can be very strong for a mid-handicapper, and very ordinary for a fast, skilled player.
Practical rule: a ball speed number should answer, “What happened on that shot?” not “Who is better?”
That mindset keeps the range session honest. The rest of the picture comes from what ball speed measures, how it's created, and which numbers belong in the same conversation.
What Ball Speed Actually Measures
Ball speed is the speed of the golf ball immediately after it leaves the clubface. It's usually shown in miles per hour, though some systems can also report it in meters per second. That makes it different from club speed, which is the speed of the clubhead at impact, and from “swing speed,” which golfers often use loosely for either the club or the motion as a whole.
The cleanest way to think about it
Ball speed is the result of what the golfer brought to the shot and how efficiently the club transferred energy into the ball. That's why it sits closer to the outcome than club speed alone. A player can swing quickly and still produce a weak ball speed if contact is poor, while a cleaner strike can produce a stronger number without any extra effort.
The bridge between the two is smash factor, the ratio of ball speed to club speed. In driver fitting, 1.50 is the theoretical ceiling, and a centered strike is why that number matters so much to coaches and fitters. A golfer who only watches swing speed can miss the lever, because two swings that look identical on the radar can send the ball off the face at very different speeds.
A simple example shows the difference. If a golfer swings the driver at 100 mph, then a 1.44 smash factor produces 144 mph ball speed, while 1.47 gives 147 mph, and 1.49 gives 149 mph swing speed and ball speed relationship. That's why ball speed is such a useful coaching number, it packages speed and strike into one reading.
Coach's shortcut: when ball speed rises but swing speed stays flat, contact improved. When both rise, the player likely added speed.
That definition is the anchor for everything else. Once the number is understood, the next step is putting it beside the right benchmarks instead of one universal average.
Tour and Amateur Benchmarks You Can Compare Yourself To
The useful way to read average golf ball speed is by player type, not by one headline number. A golfer at the range does not need the same benchmark as a Tour player, and a beginner absolutely shouldn't judge a short iron by a driver chart. The USGA's equipment research makes that segment-by-segment picture clear, with 167 mph for PGA Tour players, 140 mph for LPGA Tour players, 133 mph for average male amateurs, and 103 mph for average female amateurs USGA equipment research summary.
Driver benchmarks that actually help
| Skill Level | Avg Driver Ball Speed (mph) | Avg Smash Factor | Carry Distance Range (yds) |
|---|---|---|---|
| Beginner golfer | Lower than amateur tour benchmarks | Usually below centered-strike levels | Shorter, more variable |
| Mid-handicap amateur | Near the amateur reference zone | Often in the middle of the efficiency band | Moderate, shape depends on launch and spin |
| Low single-digit handicap | Above the average amateur reference | Closer to efficient contact | Stronger carry, tighter gapping |
| PGA Tour player | 167 to 171 | Near elite efficiency | Tour-length carry windows |
| Long-drive competitor | Far above elite tour averages | Extreme efficiency and speed | Very long carry windows |
The best value in that chart is not the exact carry range, it's the gap between groups. TrackMan's average male amateur driver ball speed of about 132.6 to 133 mph sits roughly 22% lower than the PGA Tour benchmark and about 7% lower than the LPGA Tour benchmark TrackMan benchmark data. That's why one golfer's “great” number can be another golfer's warm-up speed.
A few things can move the benchmark around. Temperature, altitude, and environment all affect what the golfer sees, and club-level data from coaching bays often shows that a driver benchmark doesn't translate cleanly to a 7-iron or wedge. The ball speed question gets much easier when the reader uses the band that matches the player profile, not the loudest number on social media.
For a deeper driver-only reference, the driver ball speed chart gives a cleaner entry point than a generic average. The key takeaway is simple, the right comparison is the one that matches the golfer's current level.
How Swing Speed and Smash Factor Produce Ball Speed
Ball speed doesn't appear out of nowhere. It's the product of club speed and smash factor, which is why a golfer can improve distance by hitting the center more often, even before any new speed work shows up.
The math behind the number
A 100 mph swing with a 1.45 smash factor produces 145 mph ball speed. The same swing at 1.40 smash produces 140 mph, which is a real loss of speed from nothing more than less-efficient contact swing speed and ball speed examples. That's the part golfers feel in the swing, but often miss in the data.
The effect shows up across different swing speeds too. At 85 mph, a driver strike that leaks efficiency will cap ball speed fast, which means distance disappears before the golfer thinks about adding speed. At 95 mph, the same contact improvement can produce a noticeably stronger number without changing the motion much. At 105 mph and 115 mph, the player still benefits from centered contact, but the cost of a miss gets bigger because the player expected more from the same effort.
A cleaner strike usually beats a harder swing if the golfer is chasing the next bucket of distance.
That's why smash factor is such a useful coaching lens. It points directly at the part of the swing that can improve fastest, the strike itself. A golfer who tightens contact from a low-efficiency strike to a centered one often sees more ball speed than another golfer gains from trying to swing harder.
The practical lesson is not that speed training doesn't matter. It's that speed work only pays fully when the golfer can deliver the face to the ball well enough to keep the transfer efficient. Ball speed is the number that exposes that difference right away.
Ball Speed by Club and How It Drives Distance
A driver number is only useful if it sits inside the rest of the bag. Once the golfer starts looking club by club, ball speed becomes a gapping tool, not just a bragging-rights stat.
The per-club picture
| Club | Typical Ball Speed (mph) | Approx. Carry (yards) |
|---|---|---|
| Driver | Highest in the bag | Longest carry window |
| 3-wood | Slightly lower than driver | Shorter than driver, still strong |
| 5-wood or hybrid | Lower again | Useful transition distance |
| Long iron | Steady but more speed-sensitive | Needs clean launch to hold carry |
| Mid iron | Controlled speed window | Distance depends heavily on spin |
| Short iron | Lower ball speed, tighter control | Precision matters more than raw distance |
| Wedge | Lowest ball speed in the bag | Designed for control, not max carry |
The reason that table matters is simple. Ball speed is the engine, but launch angle and spin decide how much of that engine turns into carry. A 7-iron ball speed of 120 mph can fly very differently depending on spin and launch, because too much backspin can make the shot climb and lose efficient forward progress, while a more playable spin window lets that same speed travel farther and land better.
That's also why driver speed gets so much attention. For most golfers, roughly one mph of driver ball speed translates to about two to three yards of carry, though irons respond differently and less dramatically. The exact number depends on strike, spin, and launch, so it's never as simple as speed alone.
A golfer who wants better gapping should look for a visible pattern in the bag. If the driver speed is strong but the 3-wood barely separates, the issue may be launch or strike. If the wedges are too close to the short irons in speed, the set may not be producing enough separation. Ball speed gives the fitter a clean way to see that structure.
Where Ball Speed Comes From on Different Launch Monitors
A ball speed number is only as trustworthy as the device reading it. Some systems measure with radar, some with cameras, and the setup matters because each technology sees the shot differently.
The sensor changes the meaning
Radar-based systems use Doppler technology to follow the ball's movement through space, which is why they tend to work well with a clear flight window. Photometric systems use high-speed imaging to capture the ball and club at impact, which makes them valuable in tighter indoor spaces when the hitting area is well defined. Both methods can give strong data, but they reward different environments.
That's where the golfer gets practical. A covered bay or open range can support one setup, while a garage sim may favor another. The important thing is to match the device to the space, so the ball speed reading reflects the actual strike instead of a setup limitation.
Practical rule: if the ball speed looks inconsistent, check the environment before blaming the swing.
Dialed Golf fits into this discussion as a desktop and practice workflow option for golfers who want to collect and review launch-monitor data, including CSV and import paths from multiple sources, while keeping the actual shot review tied to practice sessions. The same principle applies no matter which setup a golfer uses, the data only helps if the capture method suits the room and the range.
For a broader setup comparison, the range launch monitor guide is a useful companion. The win here is not choosing a device by brand loyalty, it's choosing a measurement method that fits the practice space and keeps ball speed believable.
Turning Ball Speed Into a Trend Worth Tracking
A single best number is fun. A trend is useful. Average golf ball speed becomes much more valuable when the golfer treats it like a record of how the strike is evolving over time instead of a one-shot grade.
What to log after each session
- Driver ball speed, because that's the easiest place to see overall efficiency.
- Smash factor, because it shows whether speed came from better contact or just more effort.
- Attack angle, because it helps explain why the same swing can launch differently.
- Carry distance, because ball speed only matters if it turns into usable yardage.
- One wedge and one 7-iron reading, because the rest of the bag tells the gapping story.
Averaging a small batch of drives works better than chasing a single missile. The same session can include a gust, a slight miss, and one adrenaline-fueled swing that would distort the picture if it stood alone. A stable number across two or three sessions is much more useful than one career-best launch.
A simple four-week cadence keeps the process grounded:
- Week 1, establish a baseline.
- Week 2, repeat the same club and setup.
- Week 3, compare strike quality and ball speed together.
- Week 4, decide whether the change came from contact, speed, or both.
If smash factor rises while swing speed stays flat, the golfer got more efficient. If ball speed rises while smash factor stays steady, the golfer likely added speed. If both stay flat but carry changes, the launch or spin window probably shifted.
For golfers who want cleaner exports and session records, the CSV import guide shows why structured shot data is easier to review than memory. The fitting takeaway is just as important, because a small ball-speed gain can matter a lot if it moves the shaft, loft, or head into a better window.
Keep this in mind: the best ball-speed record is the one that helps the next practice block, not the one that wins a clubhouse conversation.
Dialed Golf gives golfers a way to keep launch-monitor work, course use, and practice data in one record across app and desktop. For readers trying to make sense of average golf ball speed and turn it into better gapping, cleaner fits, and a more organized practice session, Dialed Golf is worth a look.