

A golfer checks a launch-monitor session after hitting a bucket of drivers and sees ball speed, carry distance, and perhaps one tidy club-speed number. The figures look precise, but the underlying question is less simple: is that number measured directly, inferred from ball flight, or calculated from another column?
That distinction matters. Golf swing speed calculations are useful when the input, formula, units, and measurement conditions are clear. They become misleading when a carry estimate is treated like radar data or when a single outlier becomes the golfer's new personal benchmark. The practical answer is to report speed as a confidence-banded estimate, then improve that estimate with clean strikes and repeatable sessions.
Table of Contents
- Why Swing Speed Is a Calculation, Not Just a Reading
- The Core Formulas Behind Swing Speed Calculations
- Unit Conversions Every Golfer Needs
- Mapping Launch Monitor CSV Columns
- Working Example From a Sample CSV Export
- Where Speed Calculations Break Down
- A Practical Speed Calculation Checklist
Why Swing Speed Is a Calculation, Not Just a Reading
Launch monitors don't all observe the same event in the same way. A radar-based system tracks clubhead motion through a defined measurement zone. A photometric system captures or infers motion around impact, while another consumer setup may estimate club speed from ball flight or carry. Each method has assumptions about contact, launch, spin, and the environment.
That's why a golfer can see different club-speed results for apparently similar swings. Independent testing of a consumer radar device found an average reading about 2% different from a higher-end reference system, while individual swings ranged from roughly 1% slower to 6% faster than reality, according to launch-monitor measurement research. The average error looked modest, but the spread on individual shots was more important for anyone using one swing as a fitting decision.
Start with the measured variable
The first task is to identify what the monitor recorded:
- Clubhead speed is the speed of the clubhead at the stated measurement point.
- Ball speed is the ball's launch speed after impact.
- Smash factor is the ratio of ball speed to clubhead speed.
- Carry distance is an outcome influenced by speed, launch, spin, strike, ball properties, and conditions.
A report that displays “swing speed” may therefore contain a direct measurement or a derived estimate. Garmin's published R10 tolerances, for example, list clubhead speed accuracy at plus or minus 3 mph, ball speed at plus or minus 1 mph, launch angle at plus or minus 1 degree, and carry distance at plus or minus 5 yards on its support documentation. Those tolerances aren't interchangeable, and they shouldn't be collapsed into one supposedly exact speed value.
Practical rule: Before calculating anything, locate the raw column, confirm its unit, and determine whether the device measured or inferred it.
A useful workflow begins with the launch-monitor practice workflow, then treats every derived number as an estimate with a range. That approach works better for coaching, club fitting, and trend tracking than chasing the fastest single reading.
The Core Formulas Behind Swing Speed Calculations
The most useful relationship is smash factor:
Smash factor = ball speed ÷ clubhead speed
Rearrange it when the monitor exports ball speed but not clubhead speed:
Clubhead speed = ball speed ÷ smash factor
For a driver, a centered strike often falls near 1.48 to 1.50 smash factor, while irons generally produce lower ratios because loft and strike conditions change energy transfer. The ranges below are practical starting points, not universal constants.
Common Smash Factor Ranges by Club
| Club | Typical Smash Factor | Notes |
|---|---|---|
| Driver | 1.48 to 1.50 | Best suited to centered, full strikes |
| Fairway wood | 1.44 to 1.48 | Loft and strike location can widen the range |
| 5 iron | 1.38 to 1.42 | More loft reduces the ratio |
| 7 iron | 1.35 to 1.40 | Use a range rather than one fixed value |
| 9 iron | 1.32 to 1.36 | Higher loft generally produces lower efficiency |
| Pitching wedge | 1.28 to 1.32 | Partial shots make a fixed ratio less useful |
The formula is straightforward. If a driver produces 150 mph ball speed and the selected smash factor is 1.48, the implied clubhead speed is:
150 ÷ 1.48 = 101.35 mph
The result should be reported as approximately 101 mph, not as a measurement accurate to the hundredth. If the likely smash factor spans 1.45 to 1.50, the same 150 mph ball speed implies a wider club-speed interval. That interval reflects uncertainty in contact and delivery rather than a failure of arithmetic.
Carry-distance back-solving
Carry can provide a secondary estimate when ball speed is missing, but it's much noisier. A calibrated distance curve may map a driver carry around 250 yards to approximately 107 to 110 mph clubhead speed, as described in the driver ball-speed reference. That estimate depends heavily on launch and spin, so it shouldn't replace direct club-speed data.
Don't stack conversions. Dividing carry by a distance shortcut, converting that result into ball speed, and then dividing by smash factor compounds assumptions. Use direct clubhead speed first, ball speed divided by a realistic smash-factor range second, and carry back-solving only when the other inputs are unavailable.
Unit Conversions Every Golfer Needs
A clean calculation can still fail if a CSV mixes mph and meters per second. Device exports may use regional settings, and unit labels can be hidden in the application rather than in the column header. Normalizing the file before calculating averages prevents a correct formula from producing an unusable comparison.
The essential factors are:
| From | To | Multiplier | Example |
|---|---|---|---|
| mph | m/s | 0.44704 | 100 mph × 0.44704 = 44.704 m/s |
| m/s | mph | 2.23694 | 67.4 m/s × 2.23694 ≈ 150.7 mph |
| fps | mph | 0.6818 | 112 fps × 0.6818 ≈ 76.36 mph |
| mph | km/h | 1.60934 | 100 mph × 1.60934 ≈ 160.93 km/h |
Worked examples
A ball-speed value of 67.4 m/s becomes approximately 150.7 mph:
67.4 × 2.23694 = 150.766 millionths?
More usefully, rounded to normal golf-reporting precision:
67.4 × 2.23694 ≈ 150.7 mph
A clubhead-speed value of 112 fps becomes approximately 76.36 mph:
112 × 0.6818 = 76.3616 mph
To express that same reading in kilometers per hour:
76.3616 × 1.60934 ≈ 122.9 km/h
The safest practice is to select one internal unit, convert every row into that unit, and retain the original column for auditability. For most golf comparisons, mph is easiest to read. For international CSVs or technical analysis, m/s can be cleaner, provided every source is normalized before the average or smash-factor calculation.
Mapping Launch Monitor CSV Columns
CSV cleaning starts with names, but names alone aren't enough. A field called “Speed” may describe clubhead speed, ball speed, or a release measurement. Older exports may omit smash factor entirely, while regional settings can change units without changing the header.
The working method is to create a normalized schema with separate fields for club_speed, ball_speed, smash_factor, launch_angle, spin_rate, and carry_distance. Preserve the original columns beside those standardized fields so every calculated value can be traced back to its source.
Typical field mapping
| Device | Swing Speed Column | Ball Speed Column | Smash Factor Column | Default Unit |
|---|---|---|---|---|
| Garmin R10 | Club Speed | Ball Speed | Smash Factor | mph |
| Rapsodo | SpeedAtImpact | BallSpeed | Often available or derived | mph, with optional m/s |
| SkyTrak | ShotSpeed | BallSpeed | Often derived | Imperial settings |
| FlightScope | ClubHeadSpeed | BallSpeed | Often available or derived | mph or m/s |
These labels represent common export patterns, not a guarantee for every firmware version or application mode. A field named ShotSpeed may be the relevant club-speed value in one export, while SpeedAtImpact may be the more precise impact-speed label in another. The analyst should inspect sample values before mapping anything automatically.
The common traps
Duplicate speed fields often appear when a platform stores both release speed and impact speed. They aren't interchangeable. The impact value is usually the relevant field for smash-factor work, but the file's documentation and sample behavior should decide the mapping.
Missing smash factor isn't a dead end. Calculate it as ball speed divided by club speed when both direct fields exist. If only ball speed remains, use a club-specific interval and mark the result as derived.
Hidden units cause some of the worst errors. A value that looks like a normal mph driver speed may be m/s, and a spreadsheet can calculate it perfectly while producing nonsense. The CSV import workflow is most reliable when units are made explicit before any filtering or aggregation.
A multi-device practice record also needs interoperability. File-based workflows commonly accommodate data from Garmin, Rapsodo, SkyTrak, FlightScope, Uneekor, GSPro, Awesome Golf, and other ecosystems, which makes normalization more valuable than a device-specific formula.
Working Example From a Sample CSV Export
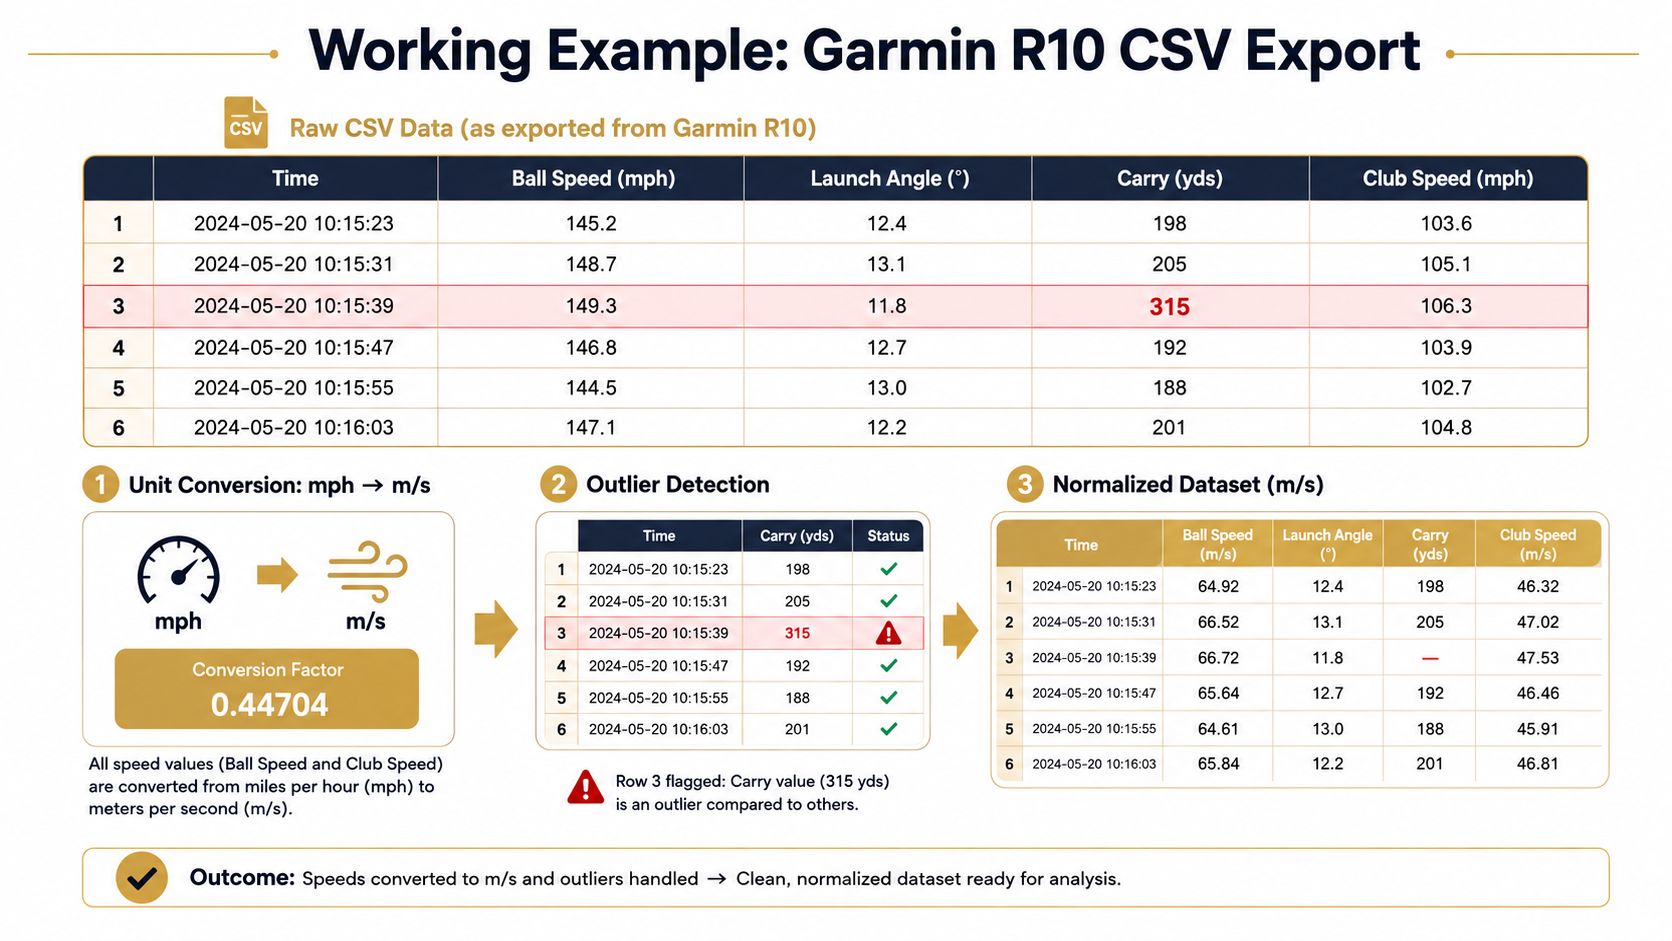
A small sample makes the workflow easier to audit. The following illustrative six-row export uses mph for speed, one missing club-speed value, and one carry outlier. It demonstrates the arithmetic without treating the sample as a measured case study.
| Row | Ball Speed (mph) | Launch Angle | Carry (yds) | Club Speed (mph) |
|---|---|---|---|---|
| 1 | 135 | 14.0° | 190 | 92 |
| 2 | 140 | 15.0° | 200 | 95 |
| 3 | 142 | 14.5° | 315 | 96 |
| 4 | 138 | 13.5° | 185 | 94 |
| 5 | 145 | 16.0° | 210 | 98 |
| 6 | 136 | 14.2° | 195 | blank |
Normalize the units
Suppose the analysis workbook uses m/s. Convert each speed with:
m/s = mph × 0.44704
For row 1:
135 × 0.44704 = 60.2004 m/s
For row 5:
145 × 0.44704 = 64.8208 m/s
The same conversion applies to club speed. Row 1's 92 mph becomes:
92 × 0.44704 = 41.12768 m/s
Back-solve the missing club speed
Row 6 has 136 mph ball speed but no club-speed entry. Use a driver smash-factor assumption of 1.48:
136 ÷ 1.48 = 91.8919 mph
Convert the derived value:
91.8919 × 0.44704 ≈ 41.074 m/s
Because the ratio is an assumption, row 6 should be labeled “derived,” not “measured.”
Remove the carry outlier
The carry values are 190, 200, 315, 185, 210, and 195 yards. The 315-yard result is inconsistent with the surrounding rows and should be flagged for review. A median absolute deviation workflow first finds the median, then calculates each row's absolute distance from that median, then identifies unusually distant observations.
For the five plausible rows, the median carry is 195 yards. Their absolute deviations are 5, 5, 10, 10, and 0 yards. Row 3 is visually and statistically exceptional in this small sample, so it's excluded from the baseline average, while the raw row remains in the audit file.
Data-handling rule: Filtering should remove an observation from a summary, not erase it from the original export.
The remaining club speeds are 92, 95, 94, 98, and 91.8919 mph. Their mean is:
(92 + 95 + 94 + 98 + 91.8919) ÷ 5 = 94.1784 mph
The sample standard deviation is approximately 2.45 mph. A 90% confidence interval for the mean, using a small-sample t multiplier of approximately 2.132, is:
94.1784 ± (2.132 × 2.45 ÷ √5)
94.1784 ± 2.34 mph
The resulting interval is approximately 91.84 to 96.52 mph. That interval describes uncertainty around this sample mean, not the monitor's full accuracy tolerance or the golfer's maximum potential.
Where Speed Calculations Break Down
A formula can't repair a weak input. Portable radar may measure club motion at a defined point rather than across the entire swing arc, and indirect systems may infer speed from ball behavior. A number can therefore be internally consistent while still missing the golfer's actual impact speed.
Measurement dispersion is the first warning. The independent device review cited earlier found single-swing readings ranging from roughly 1% slower to 6% faster than a higher-end reference, even though the average difference was about 2%. That's why repeat shots matter more than a single spectacular peak.
The smash-factor problem
A fixed 1.48 assumption works as a rough driver baseline for a centered strike, but it breaks down on partial shots, mishits, irons, and unusual deliveries. A heel strike can reduce ball speed without reducing the club's motion by the same amount, which makes the calculated speed look higher if the analyst blindly divides by an ideal ratio.
Carry-based back-solving adds more uncertainty. Launch angle, spin, strike quality, temperature, altitude, and ball condition can all change carry without changing clubhead speed. A golfer who uses one distance formula across different sessions may end up tracking weather and contact differences instead of speed.
Use a confidence band
Garmin's published tolerances show why derived outputs need context, with clubhead speed listed at plus or minus 3 mph and carry at plus or minus 5 yards in its support material. Those values belong to different metrics and shouldn't be added together, but they illustrate the broader point: the displayed precision exceeds the practical certainty.
The useful report is therefore not “speed equals 96 mph.” It is “clean-shot club speed centers near 96 mph, with a working range shaped by the monitor, formula, strike quality, and sample size.” That format supports better decisions about practice and fitting.
A Practical Speed Calculation Checklist
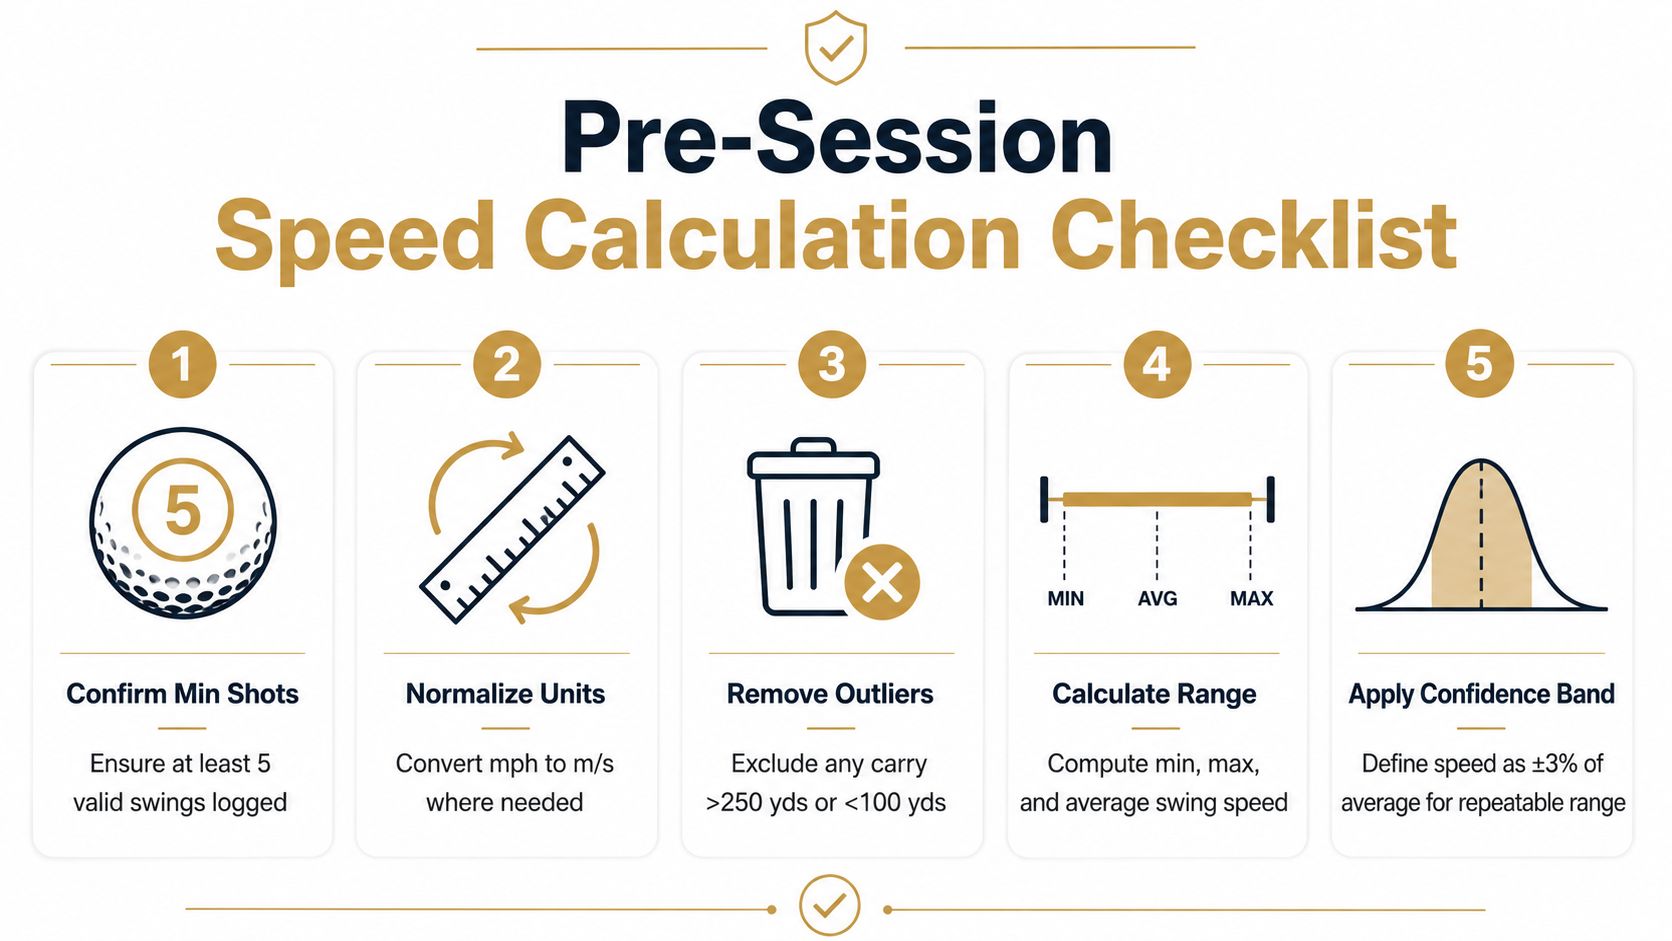
The repeatable process is simple once the data is organized. Begin with the device and file, not the formula, then separate measured values from values calculated using assumptions.
Confirm the device and units. Identify whether the speed field is clubhead speed, ball speed, or an estimate. Convert mph, m/s, fps, and km/h into one consistent unit before averaging.
Isolate clean strikes. Keep shots that represent the club and swing being evaluated. Mishits can still be useful for dispersion analysis, but they shouldn't define a centered-strike speed baseline.
Calculate the ratio. When both speeds exist, compute
ball speed ÷ club speedto verify smash factor. When club speed is missing, calculateball speed ÷ assumed smash factor, then label the result as derived.Back-solve carry only as a fallback. Carry can suggest a speed window, but it shouldn't outrank direct club or ball-speed data because launch and spin change the distance outcome independently.
Document the confidence band. Record the device, unit, club, strike filter, formula, assumed smash factor, sample size, and resulting range. The peer-reviewed protocol described in golf biomechanics research used a warm-up, practice shots, rest periods, and the highest value from maximal drives. That peak-oriented design differs from a session average, so the reporting choice should match the question.
A session average is usually better for tracking repeatable performance, while a peak can identify maximum potential. Neither should be compared casually with a different protocol.
For golfers who want one record across on-course practice and launch-monitor sessions, Dialed Golf provides a consumer app in TestFlight, desktop live pairing beginning with Garmin R10 and expanding, and CSV imports across Garmin, Rapsodo, SkyTrak, FlightScope, Uneekor, GSPro, Awesome Golf, and more. The consumer app is a pocket caddy rather than a general-availability App Store release, and the desktop workflow is the live-pair-first practice product.
The most useful trend is not the fastest number in a session. It's the stable relationship between club speed, ball speed, smash factor, launch, spin, and carry under comparable conditions. Repeated, normalized data turns golf swing speed calculations from a guess into a practical performance signal.
Visit Dialed Golf to organize launch-monitor sessions, normalize imported practice data, and keep speed trends connected to one golfer record. Use the desktop workflow for live-pair or CSV-based analysis, then carry the resulting insight into the consumer pocket-caddy experience on the course.