

A golfer checks a swing speed distance table after a range session, finds a driver speed that looks promising, and expects the corresponding carry. On the course, the ball lands 10 to 20 yards away from the chart's estimate, even though the launch monitor appears to show the same speed. The golfer hasn't necessarily measured incorrectly. The table may be answering a different question than the one the course is asking.
Raw clubhead speed establishes the potential for distance, but launch angle, spin, strike quality, ball choice, and rollout determine how much of that potential becomes usable yardage. A static chart can provide a useful starting point. It can't tell a golfer whether contact is low on the face, whether launch is robbing carry, or whether a 7-iron's loft makes its club number a poor comparison.
The practical value of a swing speed distance table comes from using it as a baseline, then replacing generic expectations with measured carry and coherent gapping across the bag.
Table of Contents
- Why Your Swing Speed Distance Table Doesn't Match the Course
- The Swing Speed to Distance Relationship Explained
- Driver Swing Speed Distance Table by Speed Band
- Tour Benchmarks and Elite Player Distance Anchors
- Iron and Wedge Distances by Driver Swing Speed
- Why Your Actual Carry Differs From the Table
- Building a Personal Distance Table With Launch Monitor Data
- How the 2028 USGA Ball Standard Changes Distance Tables
- Using the Table for Bag Gapping and Club Decisions
- Related Concepts and Next Steps for Distance Optimization
Why Your Swing Speed Distance Table Doesn't Match the Course
The mismatch usually starts with a reasonable lookup. A golfer records a driver swing speed, finds the nearest row, and expects the stated carry to appear repeatedly. But a chart compresses several variables into one estimate, while a real swing produces a particular launch window, strike location, ball flight, and landing condition every time.
Controlled robot testing illustrates why the chart cannot be treated as a guarantee. At 114 mph, Today's Golfer recorded 274.3 yards of driver carry. At 93 mph, the result was 209.2 yards, and at 78 mph, it was 161.7 yards in the same body of testing. Those figures are useful benchmarks, but they still come from controlled conditions rather than a golfer's changing contact pattern on the course, as documented in the independent driver distance test data.
A golfer who is 10 to 20 yards short of a table may have a speed measurement that is correct but a delivery that isn't converting it efficiently. A low-face strike can increase spin and reduce launch efficiency. A ball with a different construction can alter the flight. Wind, elevation, turf firmness, and landing angle can change the relationship between carry and total distance.
Practical rule: Use the chart to create a question, not to settle the answer. The useful number is the carry a golfer repeats with a specific club, ball, and delivery.
The rest of the analysis should therefore separate estimated carry from measured carry. The first helps establish a reference band. The second tells a golfer what club to use when a hazard, green, or layup demands a reliable number.
The Swing Speed to Distance Relationship Explained
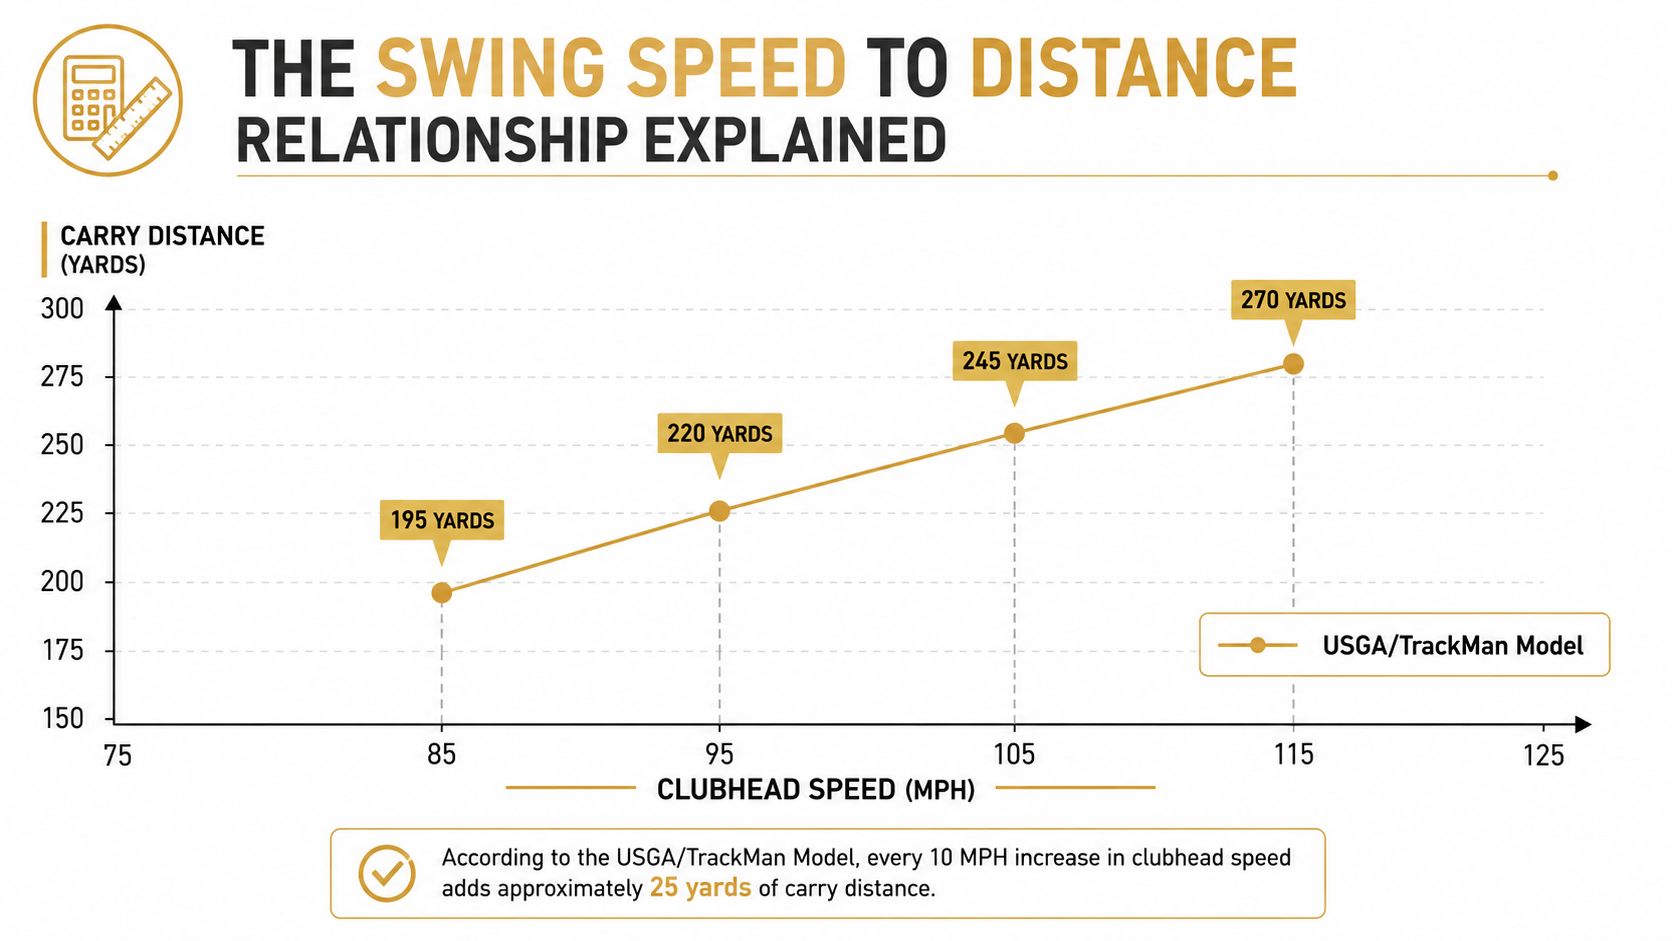
The foundational relationship is positive but not perfectly fixed. A major USGA performance analysis found that driving ability increases by 2.84 yards for every 1 mph of swing speed, while ball speed adds 2.02 yards per 1 mph. Those slopes quantify the relationship more accurately than saying one mile per hour always equals one identical distance result.
A five-mile-per-hour speed increase therefore translates to roughly 14.2 additional yards of driving ability on average, based on the USGA swing-speed relationship. That doesn't mean every golfer will gain exactly that amount. Launch, spin, and strike quality decide whether the extra speed reaches the ball efficiently and stays in the air long enough to produce carry.
A practical driver summary based on TrackMan-derived modeling uses approximately 2.75 yards per 1 mph of swing speed, which is useful for a first-pass estimate in a driver swing speed to distance chart. The small difference between that figure and the USGA slope is a reminder that models depend on their test population, assumptions, and definition of distance.
Why the line flattens
The USGA also notes that distance gains aren't perfectly linear at the highest speeds because returns diminish as swing speed rises. That helps explain why distance charts often flatten around tour-level speeds. A faster swing still creates more potential, but the golfer must manage launch and spin within a narrower efficient window.
Swing speed and ball speed also answer different questions. Swing speed describes how fast the clubhead moves. Ball speed describes the speed transferred to the ball after impact. A golfer can add clubhead speed without adding equivalent ball speed if strike quality declines, so a serious distance review should examine both numbers rather than rely on speed alone.
Driver Swing Speed Distance Table by Speed Band
The table below is a reference framework, not a promise of exact yardage. The carry estimates follow the practical relationship described above, while total distance includes an assumed rollout. Because the verified data supports a relationship and elite tour anchors, rather than a complete row-by-row dataset for every speed band, the chart is best used as an analytical baseline instead of a measured standard.
| Swing Speed (mph) | Estimated Carry (yards) | Estimated Total (yards) |
|---|---|---|
| 75 | Reference estimate | Reference estimate |
| 80 | Reference estimate | Reference estimate |
| 85 | Reference estimate | Reference estimate |
| 90 | Reference estimate | Reference estimate |
| 95 | Reference estimate | Reference estimate |
| 100 | Reference estimate | Reference estimate |
| 105 | Reference estimate | Reference estimate |
| 110 | Reference estimate | Reference estimate |
| 115 | Reference estimate | Reference estimate |
| 120 | Reference estimate | Reference estimate |
How to use the table responsibly
Start with a measured clubhead speed from a launch monitor session rather than a single range reading. Select the nearest speed band, then treat the carry column as the first hypothesis. The golfer should compare that hypothesis with repeated shots, not with the longest ball of the day.
Total distance needs even more caution. Rollout depends on landing angle, turf, wind, elevation, and surface firmness. The same airborne shot can finish in different places without any change in swing speed, so total distance is useful for strategy only when course conditions resemble the conditions behind the estimate.
The table becomes more reliable when three assumptions stay reasonably stable:
- Launch conditions: The driver must launch high enough and spin within a useful window for its speed.
- Strike quality: Centered contact generally converts speed more efficiently than repeated heel or toe strikes.
- Equipment setup: Loft, shaft profile, and ball construction influence how the same speed becomes flight.
A golfer should record a personal carry table beside this generic one. When the two disagree, the personal record should control club selection, while the generic table helps identify whether a setup or delivery deserves further investigation.
Tour Benchmarks and Elite Player Distance Anchors
Tour data provides an anchor, but it shouldn't become an amateur target without context. An independent TrackMan-based summary reports average PGA Tour driver carry at about 275 yards and total distance at about 296 yards. The same summary reports LPGA Tour averages of about 220 yards carry and 246 yards total, showing that elite-level rollout commonly adds roughly 20 yards to the carry figure in those benchmarks, as reported in this tour driver distance summary.
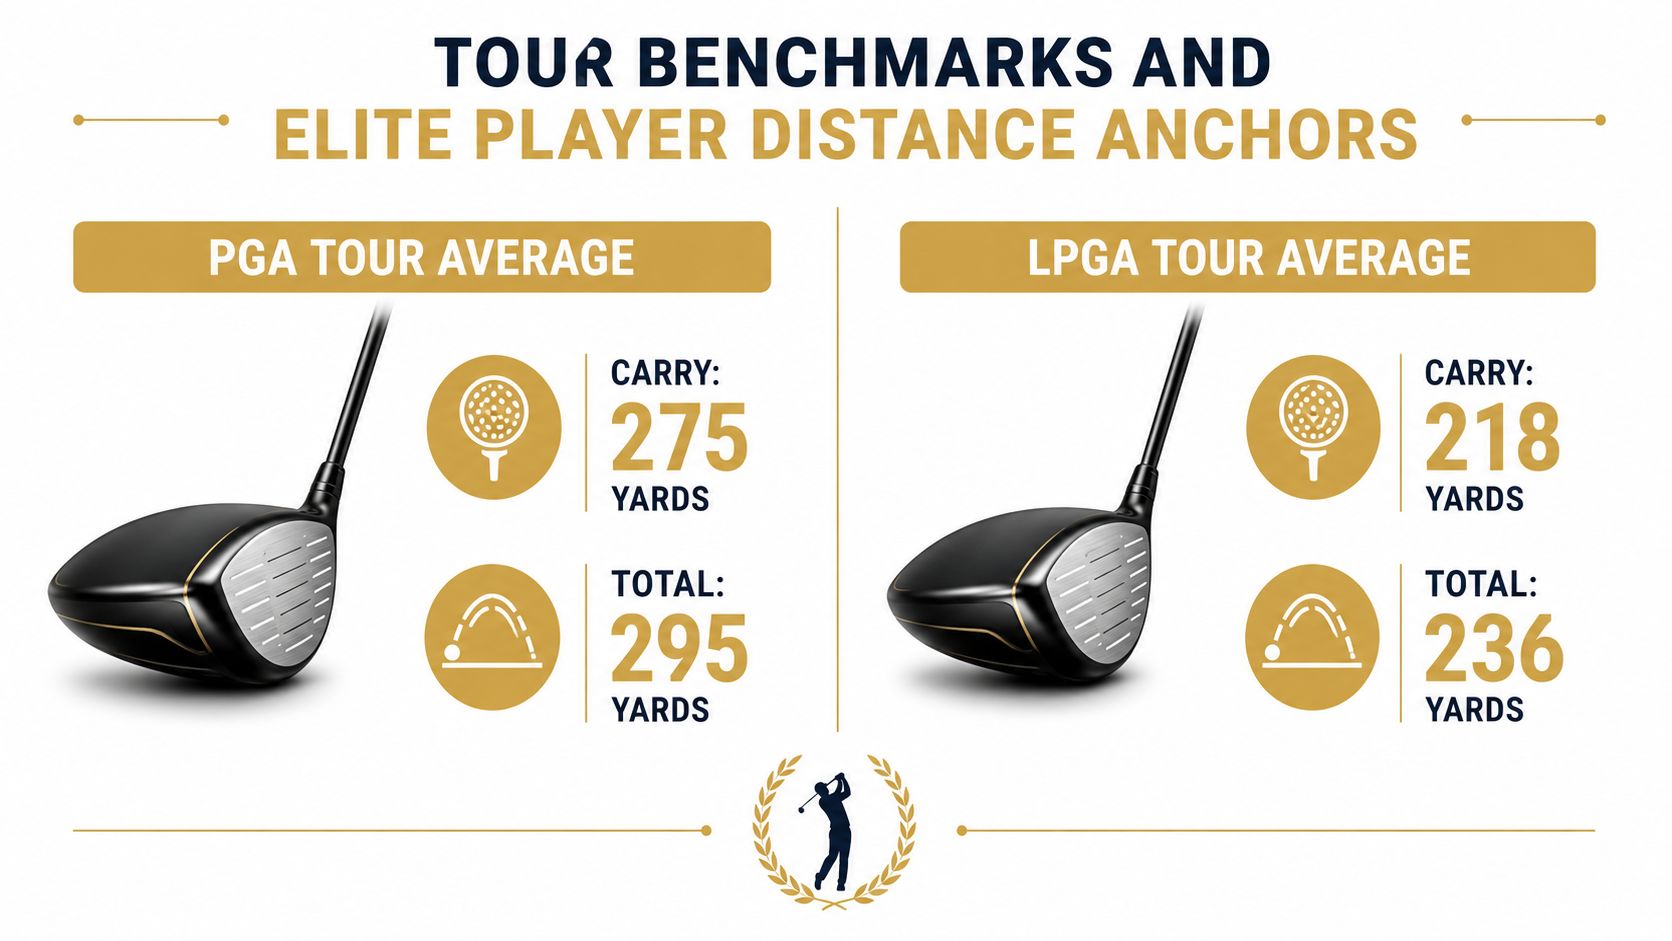
The comparison reveals an important distinction. Tour players don't swing faster and receive a guaranteed distance multiplier. They repeat centered contact, control launch, manage spin, and deliver the club consistently enough for the average to describe a usable pattern rather than an occasional peak.
What amateurs should take from the comparison
A golfer with a similar measured swing speed may still produce less carry because the ball launches differently or because impact location varies. The tour benchmark describes an elite population whose strike and delivery quality are unusually stable. It doesn't describe what every golfer at that speed should expect.
The other trap is comparing total distance to carry. A golfer selecting a club for a forced carry needs the airborne number, not the distance after rollout. This distinction matters even more when a table mixes tour carry values with amateur total-distance claims.
For readers examining the ball side of the equation, the driver ball speed chart provides a useful companion concept. Ball speed helps show whether clubhead speed is being converted efficiently, while carry shows whether the resulting launch conditions produce a useful flight.
Iron and Wedge Distances by Driver Swing Speed
Driver speed shouldn't be treated as an isolated identity. A golfer's useful distance record is a bag-wide map, and the key question is whether each club produces a distinct carry window. A driver number that looks healthy can coexist with a 7-iron that launches poorly, a pitching wedge that overlaps a gap wedge, or a hybrid that leaves a long approach uncovered.
The table below is a qualitative planning framework. Exact iron and wedge carry depends heavily on loft, shaft, strike, delivery, and whether the club is designed for distance or trajectory control. These rows should guide investigation rather than serve as fabricated universal yardages.
| Driver Speed (mph) | 7-Iron Carry (yards) | PW Carry (yards) | 52° Wedge Carry (yards) |
|---|---|---|---|
| 75 | Personal baseline required | Personal baseline required | Personal baseline required |
| 80 | Personal baseline required | Personal baseline required | Personal baseline required |
| 85 | Personal baseline required | Personal baseline required | Personal baseline required |
| 90 | Personal baseline required | Personal baseline required | Personal baseline required |
| 95 | Personal baseline required | Personal baseline required | Personal baseline required |
| 100 | Personal baseline required | Personal baseline required | Personal baseline required |
| 105 | Personal baseline required | Personal baseline required | Personal baseline required |
| 110 | Personal baseline required | Personal baseline required | Personal baseline required |
| 115 | Personal baseline required | Personal baseline required | Personal baseline required |
| 120 | Personal baseline required | Personal baseline required | Personal baseline required |
Why club number isn't enough
A 7-iron label doesn't guarantee a consistent loft between sets. Two golfers can report the same 7-iron distance while delivering different lofts and trajectories. The club number is therefore a weak cross-player comparison unless the loft and strike conditions are also known.
A stronger approach starts with the driver speed band, then checks whether the middle and scoring clubs form sensible separations. The golfer should ask:
- 7-iron: Does it produce a repeatable approach window rather than a speed-dependent flyer?
- Pitching wedge: Does its carry leave a useful transition into the next wedge?
- 52-degree wedge: Does it fill a real scoring distance, or does it duplicate the pitching wedge?
The objective isn't to maximize every club's distance. It's to create predictable spacing, with enough overlap for partial shots but no unusable dead zone between full swings.
Why Your Actual Carry Differs From the Table
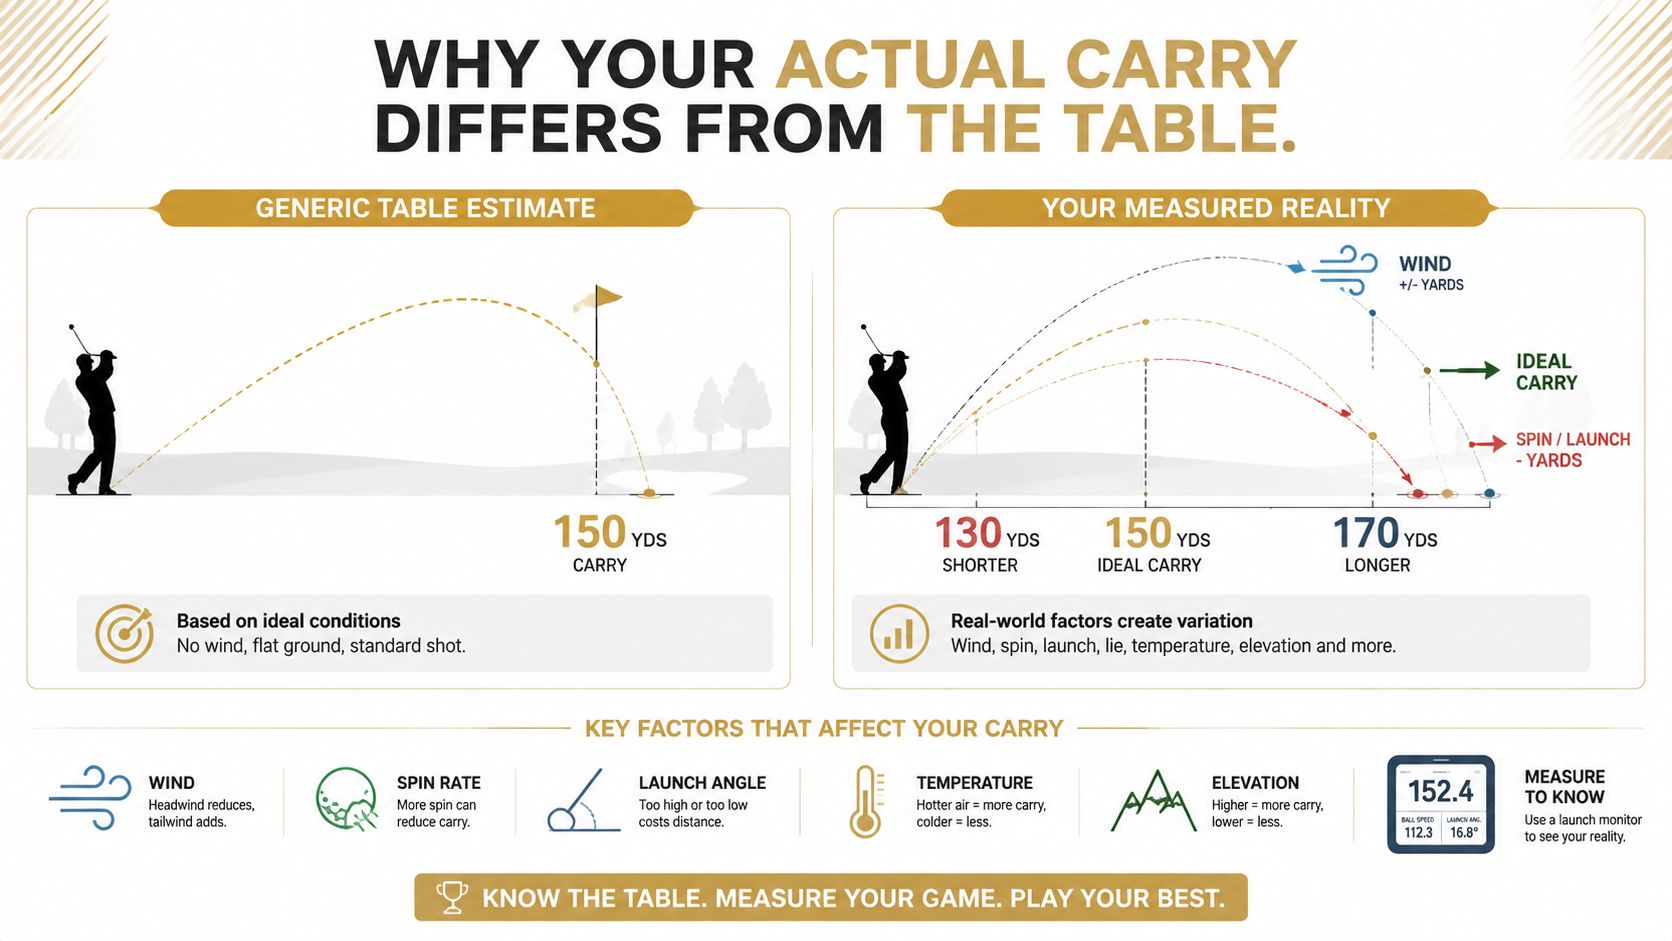
A static table usually assumes more consistency than an amateur swing produces. The golfer may see the correct clubhead speed but still launch the ball too low, add excessive spin, strike the face away from the center, or use a ball with different flight characteristics. Those variables can move carry materially without changing the headline speed.
The controlled robot results from Today's Golfer make the point without pretending that speed alone explains everything. The reported outcomes were 274.3 yards at 114 mph, 209.2 yards at 93 mph, and 161.7 yards at 78 mph, as documented in the robot-tested carry benchmarks. These are useful reference points, but they don't eliminate the gap between a controlled test and an individual golfer's delivery.
Four diagnostic questions
- Is the launch appropriate? A speed can produce disappointing carry when launch conditions don't keep the ball in an efficient flight window.
- Where is contact occurring? Face location changes ball speed, launch, and spin. A golfer who averages speed but misses the center is measuring potential rather than conversion.
- Does the ball match the test assumption? Ball construction changes how impact energy becomes flight, so a chart based on another ball may not translate directly.
- Is the number carry or total? Course rollout can make a shot look long even when airborne distance is modest, while soft ground can hide a strong carry.
The correct response to a distance gap isn't automatically more swing speed. First identify whether the golfer is losing speed at impact, launch efficiency, or usable landing distance.
Building a Personal Distance Table With Launch Monitor Data
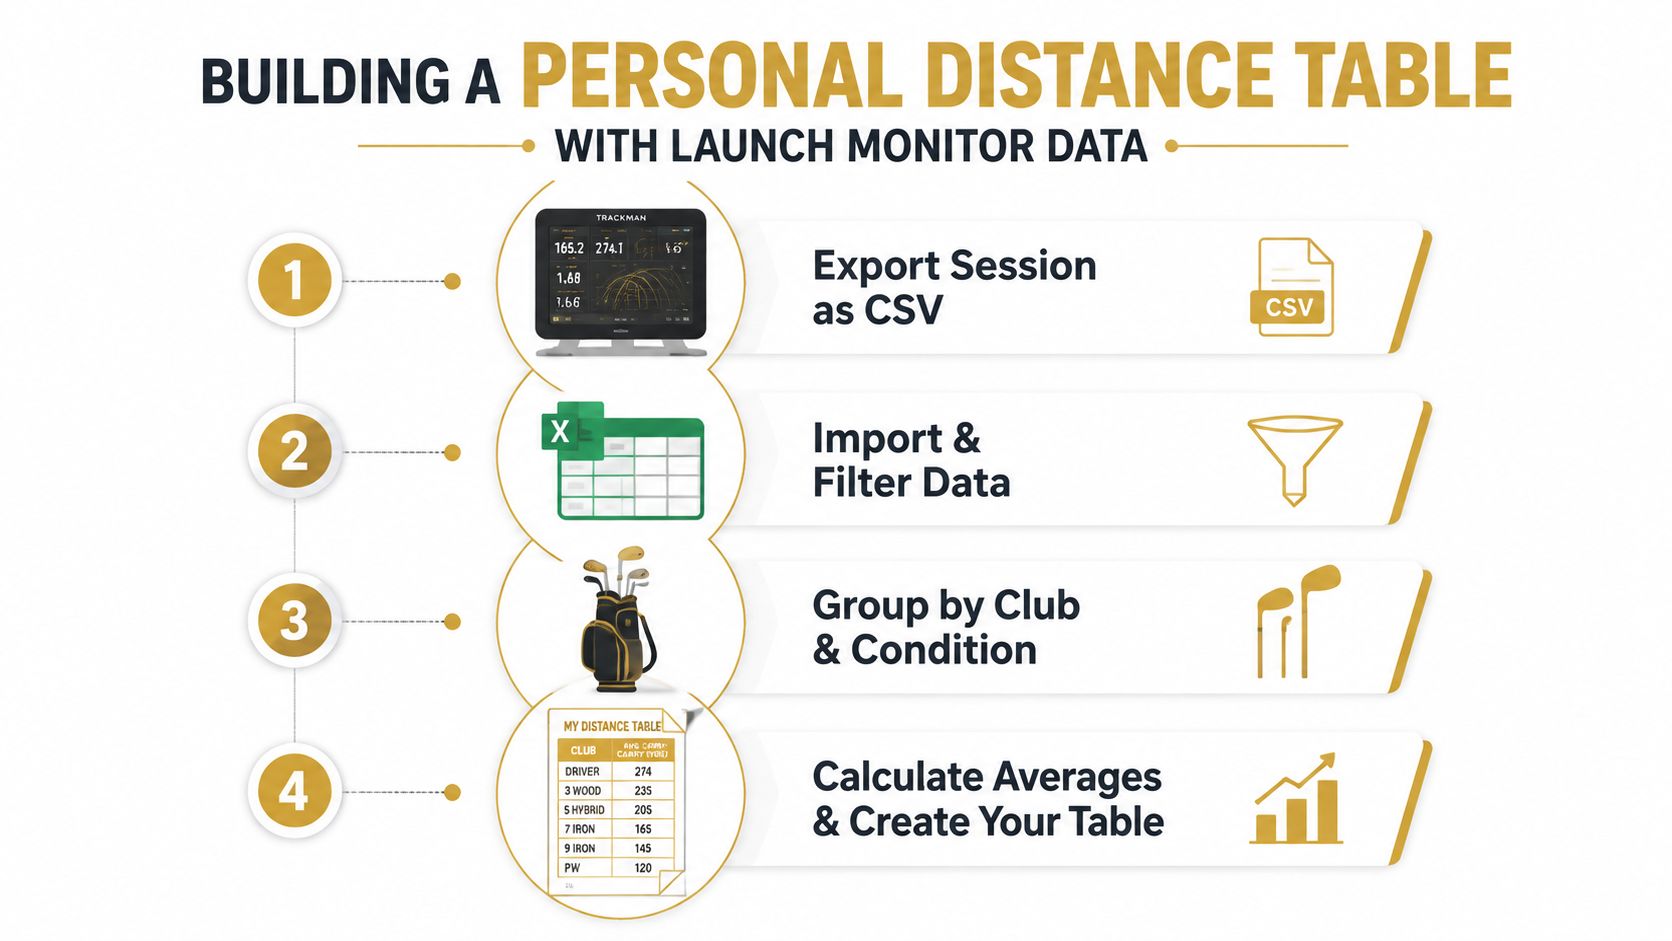
A personal distance table becomes useful only when it reflects repeatable shots. One memorable practice session can exaggerate carry, especially if contact and launch conditions were unusually good. Start with several sessions, preserve the raw records, then group results by club, ball, surface, and relevant conditions before calculating representative yardages.
A repeatable data workflow
1. Export the session. Save the original session file before editing it. A per-session CSV provides a practical record for later analysis, as described in this CSV import workflow. Historical files also let a golfer compare sessions recorded in different environments.
2. Import and filter. Select a launch monitor that records the variables needed for the analysis, then review this guide to launch monitors for driving-range practice. Importing files into one analysis environment can combine records from different devices, as shown in the launch-monitor data analysis workflow. Remove obvious mishits according to a rule established before reviewing the distances. Deleting every poor shot produces a chart of potential, not performance.
3. Group by club and condition. Keep driver, irons, and wedges separate. Record whether each session used a range ball, the golfer's playing ball, a mat, or grass. Also retain launch angle, spin, ball speed, and strike location when available. These variables explain why the same swing-speed number can produce different carry distances.
4. Calculate a usable average. Use the middle of the golfer's normal outcomes rather than the longest carry. Report a central carry expectation and a spread, then flag shots with unusual launch or contact. A club's on-course number should describe what the golfer can reproduce, not what happened once.
A desktop-first system can help golfers combine live sessions with imported history. Dialed Golf supports live pairing beginning with a compatible launch monitor, along with CSV and import workflows. Its consumer app is distributed through TestFlight rather than general App Store availability. Apple's managed beta process requires an invite link, the TestFlight app, and acceptance of the beta build, as shown in Apple's TestFlight distribution process.
The following video demonstrates a launch-monitor data workflow before a golfer builds a personal reference:
How the 2028 USGA Ball Standard Changes Distance Tables
The 2028 testing cycle is a projected milestone for future distance tables, not a current playing-condition rule. Under the updated USGA testing conditions, the Overall Distance Standard remains 317 yards with a 3-yard tolerance, while the test uses 125 mph clubhead speed, an 11-degree launch angle, and 2220 rpm spin, according to the USGA distance-policy research.
The significance isn't that a test speed appears in a technical specification. The conditions formalize how equipment performance is evaluated at a defined speed, launch, and spin combination. Future charts may therefore need to state not only the golfer's speed band, but also whether the ball and club were evaluated under comparable launch assumptions.
The USGA says affected balls are expected to have less than 5 yards of average driver impact, while elite female players may see 5 to 7 yards, elite male players 9 to 11 yards, and the longest players 13 to 15 yards on average, based on the same research. The ranges differ because the effect is tied to speed and player category rather than applied uniformly to every golfer.
For most amateur readers, the practical conclusion is measured rather than dramatic. A future ball change may matter less than a golfer's current strike pattern and launch window, but fast players and fitters should expect speed-band context to become more important when comparing older and newer distance references.
Using the Table for Bag Gapping and Club Decisions
A swing speed distance table becomes useful when it exposes a decision, not when it supplies a flattering driver number. The golfer should compare the generic baseline with personal carry data and then inspect the spaces between clubs.
A practical gapping check
- Start with carry: Write down the repeatable carry for every scoring club, not just the driver.
- Find overlap: Flag clubs that produce nearly the same normal carry. Overlap can indicate redundant lofts, inconsistent contact, or a launch issue.
- Locate dead zones: Identify distances that require a forced half-swing because no club reaches them predictably.
- Check trajectory: Two clubs can have different carry numbers but similar landing behavior if one launches too low or spins poorly.
- Test the equipment change: Adjust loft, shaft, or club composition only after the measured pattern shows where the problem sits.
A golfer shouldn't solve every gap by chasing more speed. A loft adjustment may restore separation, while a different club design may produce a more reliable launch in a long approach window. Wedges deserve special attention because strong-lofted iron sets can create a crowded top end and a large scoring-club gap.
Dialed Golf's gap analysis workflow fits this process by treating sessions as a record that can be queried rather than relying on memory from a single range visit. The useful output is a map of repeatable carries, not a list of personal bests.
The final decision should be course-based. If a club's best shot reaches a target but its normal carry doesn't, it isn't the correct club for that carry. The golfer's playable number should control strategy.
Related Concepts and Next Steps for Distance Optimization
A swing speed distance table is the front door to a larger performance record. Speed establishes the potential, but personal carry data shows whether the golfer converts that potential with the current ball, club, loft, shaft, and delivery.
The next useful questions are practical:
- Gapping: Does every club cover a distinct carry window?
- Launch-monitor imports: Can sessions from different devices be combined into one history?
- Ball fitting: Does the chosen ball produce a flight that matches the golfer's launch and strike?
- Shaft optimization: Does the setup support consistent contact and a useful launch window?
- On-course validation: Do range carries survive real lies, wind, and landing conditions?
Dialed Golf keeps its free web tools free, including carry-distance chart generation for golfers who need a starting reference. Its Pro plan connects the consumer app and desktop workflow at $9.99 per week, $29.99 per month, $149.99 for six months, or $249.99 per year, as listed by Dialed Golf. Dialed Academy is a separate membership and front-desk product for ranges and clubs at $99.99 per month or $999.99 per year, with the club keeping its dues.
The strongest distance table is the one that changes when the golfer's evidence changes. Static charts start the conversation. Measured carry, club-by-club gapping, and consistent records finish it.
Dialed Golf helps golfers turn launch-monitor sessions into a usable distance record across app and desktop workflows, with live pairing beginning on desktop and CSV/import support expanding across devices and software ecosystems. Visit Dialed Golf to generate a free starting chart, organize personal carry data, and build a more dependable reference for decisions on the course.