

A golfer stands over 178 yards, with a slight wind in the face and a pin tucked behind a bunker. The 4-iron looks like the disciplined choice, while the 4-hybrid feels too safe. The iron comes up short. On the next hole, the target is 192 yards, so the golfer reaches for the 5-wood, remembering the previous miss. This time the ball runs well past the target.
Those two shots reveal the problem. The bag has overlapping clubs, missing carry windows, and no dependable answer between the longest iron and shortest fairway wood. The result isn't just a few awkward swings. Golfers start making conservative decisions, forcing shots between clubs, and losing confidence in clubs they should trust.
A useful hybrid clubs distance chart fixes the guessing by putting loft, swing speed, carry, and neighboring clubs into the same picture. Published charts provide a starting range. A personal chart, built from measured carry data and checked against real turf, becomes the working reference.
Table of Contents
- The Yardage Between Clubs and Why It Matters
- What a Hybrid Distance Chart Actually Shows
- Hybrid Lofts and What Each Club Replaces
- Carry Distance Bands by Swing Speed and Handicap
- How to Read and Print a Hybrid Distance Chart
- Using a Hybrid Chart to Gap Your Bag
- Building a Personal Hybrid Chart From Launch Monitor Data
- Why Your Numbers Won't Match the Chart
- Generate and Compare Charts With Dialed Golf Tools
- When to Trust the Chart and When to Re-Test
- Putting the Hybrid Chart to Work This Week
The Yardage Between Clubs and Why It Matters
A hybrid earns its place when it solves a yardage problem. It doesn't earn that place because the club is easier to hit than a long iron.
The player facing 178 yards might have a 4-iron carrying around 180 on a perfect strike, a 4-hybrid carrying around 195, and a 5-wood carrying around 220. On paper, that looks usable. On the course, inconsistent contact can compress the first two clubs, while the fairway wood creates a large jump. Without measured carries, the golfer remembers outcomes instead of distances.
Three failure modes appear repeatedly:
- Conservative swings: The golfer chooses the club that feels safe and then makes a cautious swing, leaving the ball short of the target.
- Forced middle shots: The yardage falls between clubs, so the player tries to manufacture distance with a soft fairway wood or a hard hybrid.
- Confidence erosion: Repeated misses make the golfer avoid a club, even when that club should be the correct option.
A gap analysis needs more than a list of club numbers. The reference point should be carry distance, organized by loft and swing-speed band, then compared with the longest iron and shortest fairway wood. Fitting guidance commonly targets a 10- to 15-yard gap between adjacent clubs, which gives a hybrid a defined job instead of leaving it as a vague “rescue” option. GolfWorks' yardage-chart guidance uses carry-only recording and this gap range as a practical fitting framework.
Practical rule: A hybrid should answer a specific carry question. If nobody can state which two clubs it separates, the slot probably hasn't been measured properly.
The rest of the process is straightforward. Establish the loft, collect carry data, remove misleading total-distance comparisons, and test the club from the lies where it will be used.
What a Hybrid Distance Chart Actually Shows
Every chart contains three different measurements, but fitting decisions depend mainly on loft and carry. Total distance remains useful for course management, yet it shouldn't be the primary number used to build the set.
| Number | What It Measures | Why It Matters | Limitation |
|---|---|---|---|
| Loft | The angle built into the clubface | Predicts launch window and helps identify which club or iron slot the hybrid replaces | Loft alone doesn't reveal strike quality or actual carry |
| Carry | Distance from impact until the ball first contacts the ground | Shows whether the club clears a hazard, reaches a target, and fits between neighboring clubs | Doesn't include rollout after landing |
| Total | Carry plus the ball's roll until it stops | Helps estimate how far a shot may finish on firm ground | Changes with turf, wind, landing angle, and course conditions |
Carry is the fitting standard because it isolates the part of the shot the golfer controls most directly. Total distance depends on rollout, which changes with fairway firmness, landing angle, wind, temperature, and the ball's interaction with the ground. A chart that mixes carry in one column with total in another can make the same hybrid appear to have several different yardages.
The practical workflow is simple:
- Record the loft or club label.
- Record carry for every shot.
- Keep total distance in a separate column.
- Compare carry numbers across clubs.
- Use total distance only when planning rollout after the ball lands.
Published hybrid references show the same principle in their loft-to-distance progression. A 1-hybrid around 15° to 18° carries roughly 194 to 245 yards for men and 115 to 194 yards for women, while a 3-hybrid around 21° to 24° carries roughly 163 to 205 yards for men and 96 to 163 yards for women. The ranges are broad because a “hybrid distance” isn't a single category. The Golf Mentor's hybrid chart presents the figures as practical carry bands rather than one universal number.
When a personal launch-monitor chart is compared with a published table, all figures should be normalized to carry first. Otherwise, the chart is comparing club performance with course conditions instead of club performance with club performance.
Hybrid Lofts and What Each Club Replaces
Hybrid labels are shorthand. Loft is the more reliable identifier, especially because a 4-hybrid from one model may not match the loft of a 4-hybrid from another.
The broad progression moves from long, low-lofted hybrids into higher-lofted clubs that overlap with forgiving iron designs.
| Hybrid | Typical Loft | Replaces | Bag Role |
|---|---|---|---|
| 1H | Around 14° | 1-iron or 2-iron | Longest hybrid, usually one slot behind a strong 3-wood |
| 2H | Around 16° to 19° | 2-iron or 5-wood | Long playable option for golfers who want control from the tee or fairway |
| 3H | Around 19° to 22° | 3-iron or 5-wood | Common long-iron replacement and a primary top-of-bag gapping club |
| 4H | Around 22° to 24° | 4-iron | Higher-launching approach club for the traditional 4-iron slot |
| 5H | Around 25° to 27° | 5-iron | Forgiving replacement for golfers who struggle to launch a 5-iron |
| 6H | Around 28° to 30° | 6-iron | Utility option for slower speeds or players who need help from difficult lies |
| 7H to 9H | Around 31° to 36° | 7-iron through 9-iron | Rescue-style clubs that overlap with game-improvement irons |
Independent loft references place a 2-hybrid around 16° to 19° and a 3-hybrid around 19° to 22°, with both clubs replacing long irons or filling fairway-wood gaps depending on the set. Mitchell Golf's loft chart shows hybrids as a distinct equipment category alongside drivers, woods, and irons.
The historical reason for the category is practical. Long irons weren't eliminated because golfers suddenly stopped needing their yardages. They became less attractive because off-center strikes produced low, weak shots that struggled to launch and hold a target. Hybrids preserve a similar distance role while using a wider sole and a lower, more forgiving impact area.
A detailed loft-to-replacement reference is available in this hybrid golf club lofts chart. The useful question remains the same: which carry window does the club occupy, and does that window already belong to another club?
Carry Distance Bands by Swing Speed and Handicap
A single number beside “4H” creates false confidence. Swing speed and strike efficiency can move the result substantially, so a useful table needs bands, not a promise.
The verified hybrid reference bands below show how carry falls as loft increases. They aren't a complete fitting matrix for every swing-speed tier, but they provide a realistic framework for understanding the spread.
| Hybrid | Under 80 mph | 80-95 mph | 95+ mph |
|---|---|---|---|
| 2H | 134 to 160 yards | 160 to 178 yards | 178 to 189 yards |
| 3H | 115 to 145 yards | 145 to 180 yards | 180 to 205 yards |
| 4H | 105 to 135 yards | 135 to 175 yards | 175 to 209 yards |
| 5H | 95 to 125 yards | 125 to 160 yards | 160 to 183 yards |
| 6H | 85 to 115 yards | 115 to 145 yards | 145 to 170 yards |
The exact boundaries inside a swing-speed tier depend on contact, launch, shaft fit, and the club's actual loft. A published speed-based reference places 4-hybrid carry from 135 to 209 yards across 75 to 115 mph players, while another chart places 2-hybrid averages from 134 to 189 yards across skill tiers. MyGolfSpy's hybrid distance coverage illustrates why handicap-only charts can hide a wide performance window.
The main lesson is the width of the band. A golfer with a slower delivery and a golfer with a faster delivery can use the same loft but need entirely different yardage expectations. Handicap adds context, but it doesn't control distance as tightly as speed and strike quality. A 12-handicap golfer with a 95 mph driver speed can out-carry an 8-handicap golfer swinging 85 mph, even though the lower-handicap golfer may produce tighter dispersion.
For a focused look at one common slot, the 4-hybrid distance reference helps frame the club as a range rather than a fixed yardage. The personal chart should then replace the broad band once measured data is available.
How to Read and Print a Hybrid Distance Chart
A hybrid chart works like a map. Rows identify the hybrid loft or club label, columns identify the player tier or swing-speed band, and each cell contains either a carry number or a carry range.
A carry-only chart is easiest to use. The golfer finds the row for 3H, 4H, or 5H, moves across to the closest speed or player band, and reads the expected carry. A chart that includes both carry and total needs separate labels for each value, or it risks blending two different measurements.
The layout should answer three questions quickly:
- Which hybrid is being considered?
- What carry range fits the golfer's delivery?
- Where does that carry sit relative to the longest iron and shortest fairway wood?
The chart can be printed as a single-page PDF or compact card. A readable font matters more than decorative design, since the card may be attached to a golf bag or rangefinder clip and consulted between shots. Personal numbers can be written beside the published reference, allowing the golfer to see whether the actual carry sits near the center, top, or bottom of the expected band.
Dialed Golf's locker can filter on-screen versions by club set, which is useful when a golfer has multiple configurations. The printed version remains valuable for a quick course reference.
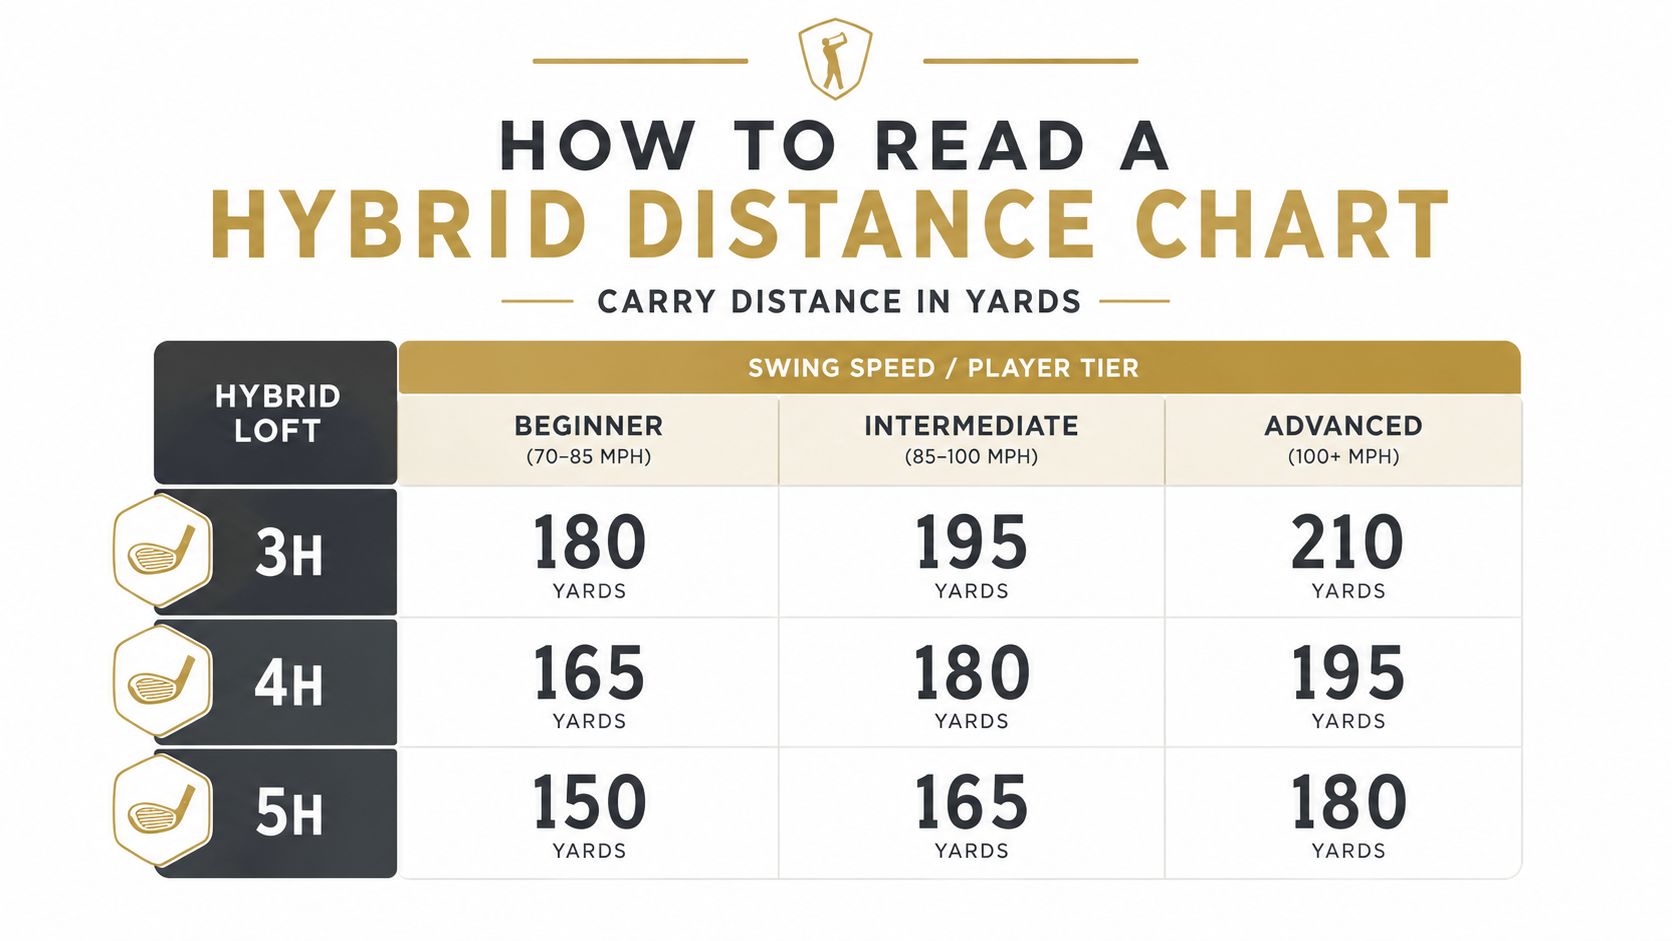
The most reliable chart has one consistent rule: carry is the default, and total is stored separately. That keeps the fitting decision stable when the course changes.
Using a Hybrid Chart to Gap Your Bag
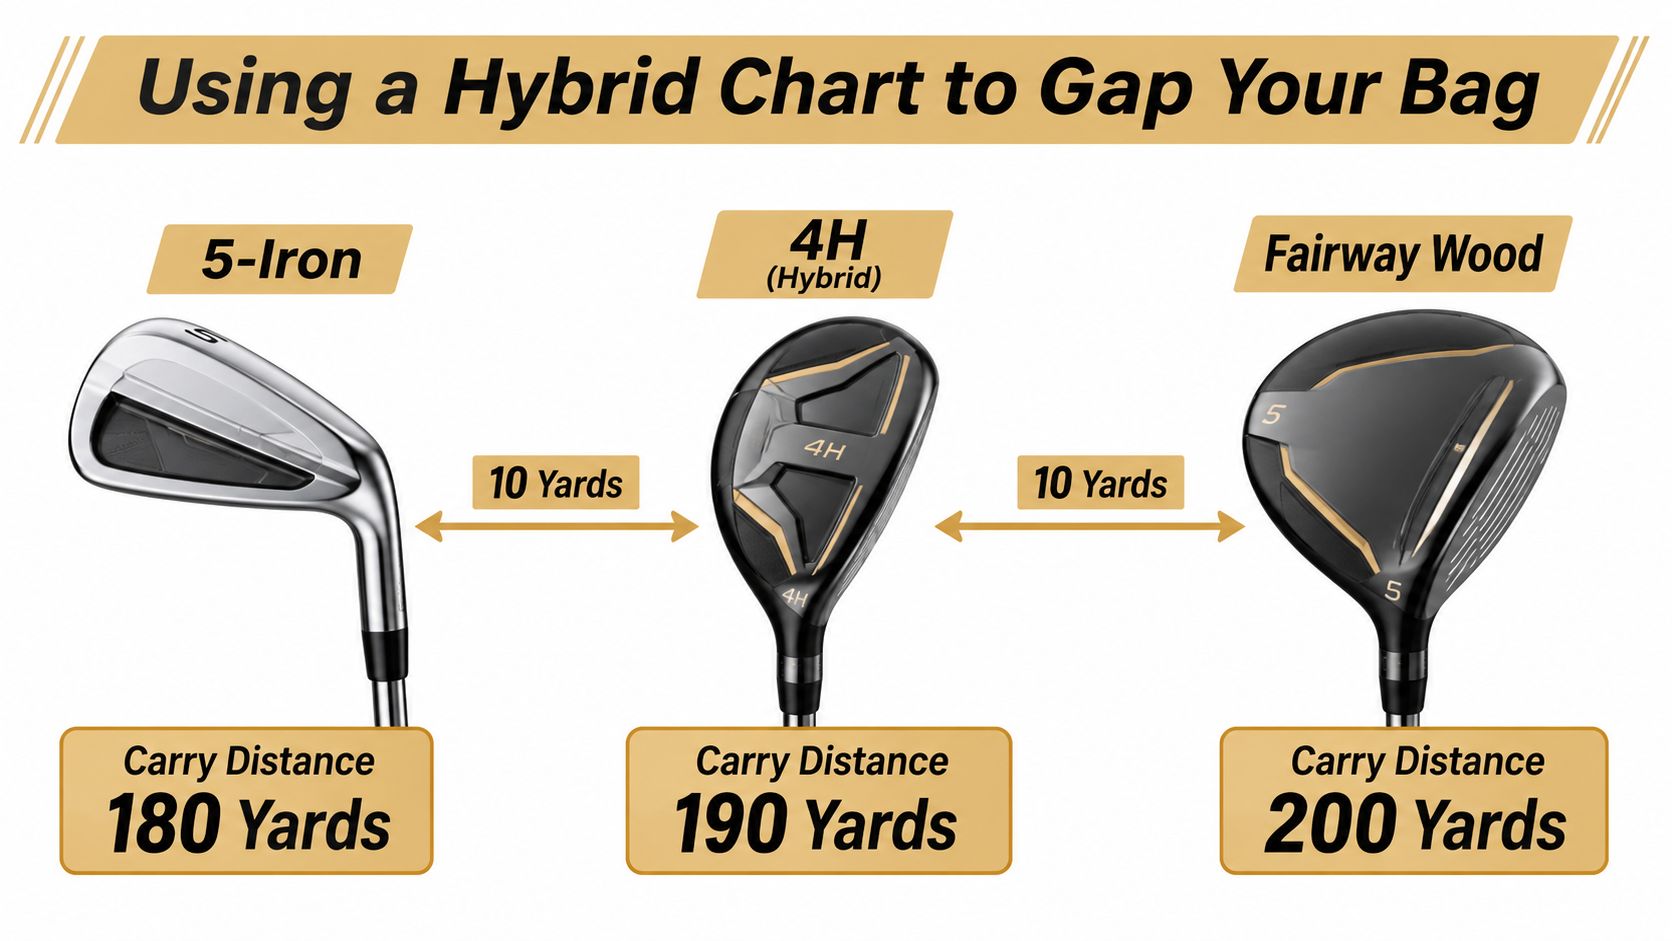
A hybrid fills a useful slot when it creates separation between the longest iron and the shortest fairway wood. The practical target is usually 10 to 15 yards of carry between adjacent clubs, as outlined in yardage-chart fitting guidance. The number isn't a commandment, but it gives the set enough structure for each club to have a distinct job.
Consider a clean top-of-bag sequence:
| Club | Carry |
|---|---|
| 7-wood | 225 yards |
| 5-hybrid | 210 yards |
| 4-hybrid | 195 yards |
| 4-iron | 180 yards |
That sequence creates gaps of 15 yards, 15 yards, and 15 yards. Each club has a recognizable landing window, and the golfer can choose based on the target rather than trying to alter the swing.
Now compare a poor setup:
| Club | Carry |
|---|---|
| 4-hybrid | 210 yards |
| 4-iron | 205 yards |
A five-yard separation is too small for most on-course decisions. The golfer may hit both clubs the same distance on ordinary strikes, while a mishit can reverse the expected order. One club should be adjusted, replaced, or removed.
A practical decision rule: If two adjacent clubs carry within 8 yards on the chart, treat one as redundant until testing proves otherwise.
The overlap isn't always caused by the hybrid. A long iron may be losing carry because it launches too low, while the hybrid may be producing its expected distance. In that case, the hybrid is doing its job, and the iron is the club to reconsider.
A 7-wood can also be a better choice than a 3-hybrid when the golfer needs height and a softer landing. A hybrid can be better from rough or a tight lie when the shorter shaft and sole provide more control. The correct answer comes from carry, launch, descent, dispersion, and the lies the player faces.
Building a Personal Hybrid Chart From Launch Monitor Data
A personal chart starts with a controlled session, not an internet average. The golfer should test each hybrid with the same ball, the same surface, and a repeatable warm-up.
A practical session looks like this:
- Warm up first. Start with shorter clubs so the first hybrid isn't recorded before the swing is ready.
- Hit a consistent group. Use 8 to 10 shots per hybrid, then record carry, total, launch angle, spin rate, and smash factor when the monitor provides them.
- Separate the outliers. Remove the two longest and two shortest shots when they clearly represent a mishit or unusual strike, then average the middle cluster.
- Preserve the raw list. The average alone hides whether the club carries tightly or produces a wide spread.
- Record conditions. Note ball type, temperature, and altitude because each can affect the result.
Carry is the primary value for gapping. Total remains useful for understanding rollout, but it shouldn't decide whether a hybrid belongs between two clubs.
The final deliverable should be a one-page table with:
- Club and stated loft
- Average carry
- Typical total distance
- Shot spread or confidence band
- Launch and spin notes
- Neighboring clubs
- Intended on-course use
A hybrid that carries 195 yards on average but ranges from 180 to 210 may be less useful than one carrying 190 with a tighter pattern. The golfer needs to know both the centerline and the uncertainty around it.
The gap analysis guide provides a structured way to organize those comparisons. The important distinction is between a club's longest recorded shot and its repeatable carry window. The latter determines whether the club can be trusted on a green approach or forced carry.
Why Your Numbers Won't Match the Chart
Published charts use a common reference point. A golfer's session uses a particular head, shaft, ball, strike, surface, and weather pattern. Those inputs won't always line up.
A mat can change how the club interacts with the ground compared with turf. Indoor testing removes wind but may introduce a different visual target and strike pattern. Outdoor testing adds temperature, elevation, and wind effects. A golfer who compares these sessions without labeling the conditions can mistake environmental drift for a swing change.
Ball choice and shaft specification also matter. A ball designed for higher spin can produce a different flight window from a lower-spin distance ball. Shaft weight and flex can alter delivery, launch, and spin, even when the clubhead and loft stay the same.
The test itself can create variation:
- Club order: Hitting every long hybrid first can produce tired swings later.
- Strike location: Toe and heel contact change ball speed and direction.
- Surface: Mats can hide heavy contact that turf would expose.
- Temperature: Cooler air and ground conditions can reduce the expected carry.
- Shot intent: A stock swing and a controlled “knockdown” swing don't belong in the same average.
The chart should be treated as a centerline, not a verdict. The golfer can compare personal carry with the published band, identify the direction of the difference, and then use measured numbers for club selection.
A launch monitor also has its own limits. An independent test of a budget radar unit found an average total-yardage difference of 6.42 yards, or 4.59%, between real-life carry and simulator carry in the tested setup. The launch-monitor accuracy test supports a sensible practice habit: pair live data with post-session review rather than accepting every single reading without context.
Generate and Compare Charts With Dialed Golf Tools
A golfer can build the chart manually from a notebook or spreadsheet, but a dedicated workflow makes it easier to preserve the raw shots and compare set changes. Dialed Golf's free Carry Distance Chart Generator accepts a launch-monitor export or manual carry and total entries, then organizes the data by club.
The process is designed for practical use:
- Paste in the shot list or enter club-level carry and total values.
- Select the preferred units.
- Plot the personal chart by club.
- Add optional reference bands for swing speed and handicap.
- Overlay the 10- to 15-yard gapping target.
- Save the version in the locker.
- Export a PDF or share the chart with a fitter.
The locker matters when equipment changes. A golfer can keep the chart created before a shaft change beside the chart created after adding a new 3-hybrid, then inspect whether the carry window moved, tightened, or overlapped another club. That history is more useful than replacing the old chart and relying on memory.
The desktop workflow supports live pairing first, with Garmin R10 and expanding device support, plus CSV and import workflows from Garmin, Rapsodo, SkyTrak, FlightScope, Uneekor, GSPro, Awesome Golf, and more. The compatibility model supports direct device connections as well as imported sessions, including CSV workflows across multiple launch-monitor ecosystems, as documented in this device compatibility matrix.
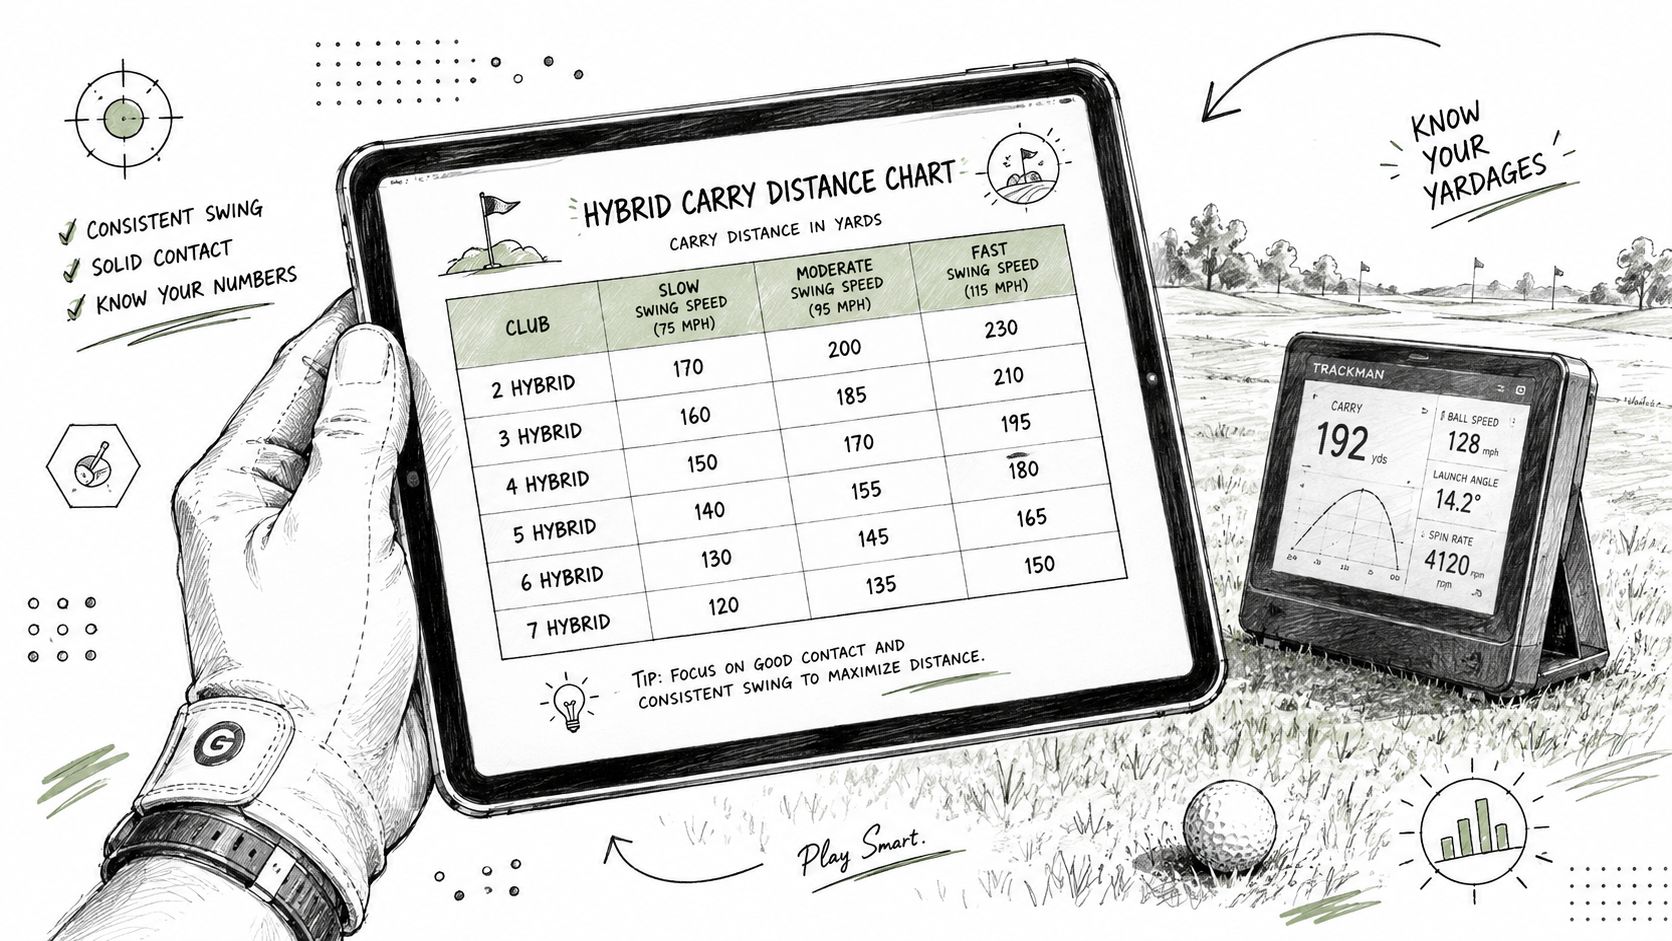
The generated chart becomes useful when it changes a club decision. A 4-hybrid that overlaps the longest iron can be flagged immediately. A missing window between a 5-hybrid and 7-wood becomes visible before it costs another approach shot.
When to Trust the Chart and When to Re-Test
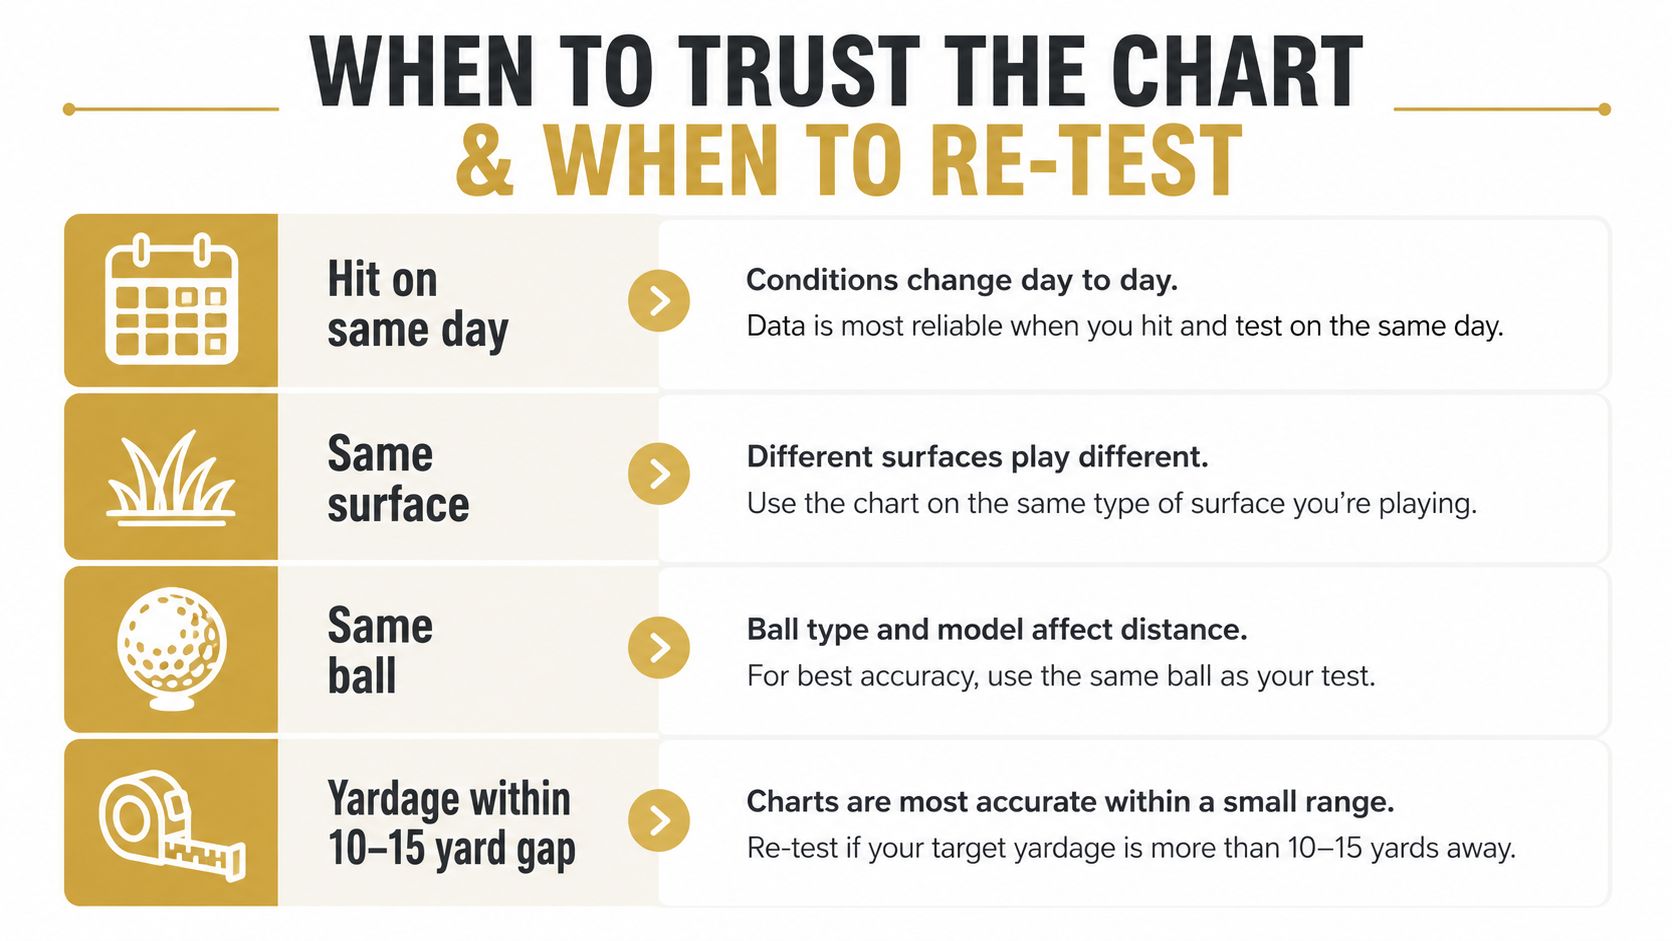
A measured chart is more useful than a published reference when the test conditions match the shot the golfer needs to play. The chart deserves trust when the clubs were tested on the same day, from the same surface, with the same ball, and the target falls inside the established carry gap.
That reliability has boundaries. A chart is a snapshot of a setup, not a permanent identity for the golfer or club.
Trust the chart when
- The testing conditions match: The surface, ball, and session environment resemble the normal practice context.
- The carry window is stable: The club produces a repeatable centerline rather than one standout shot.
- The neighboring gaps make sense: Each club has a defined space rather than a large overlap.
- The target uses carry: The course decision depends on where the ball lands, not only where it eventually stops.
Re-test after equipment or swing changes
- A new shaft or head
- A grip change
- A ball-model swap
- A swing-speed shift of more than 3 mph
- A season-long layoff
Indoor mat results may also differ outdoors by 5 to 10 yards in cooler, firmer conditions, so those sessions should be labeled rather than treated as interchangeable.
A dated log protects the golfer from rewriting history. The old result stays visible beside the new one, making it easier to identify a genuine equipment effect or a temporary swing fluctuation.
Putting the Hybrid Chart to Work This Week
Start with a carry-only chart. Write each hybrid's measured number next to the longest iron and shortest fairway wood, then mark the gaps between them.
On the course, choose the club that carries to a safe landing area, not the one that merely reaches the pin on its best strike. Keep a small note of the club, lie, wind, result, and strike quality. Three rounds of notes can expose a hybrid that consistently falls short, flies too far, or performs well only from one type of lie.
Re-test a hybrid when its observed carry has drifted more than 5 yards from the original log entry. That drift may reflect weather, strike, equipment, or a change in delivery, but the chart should prompt investigation rather than encourage guesswork.
The chart becomes valuable when it changes a decision. If it tells the golfer to leave the 4-iron at home, add a higher-lofted fairway wood, or smooth a 5-hybrid into the front of a green, it has already done its job.
Dialed Golf provides free web tools for building and printing a personal carry chart, while its desktop workflow supports launch-monitor practice through live pairing first and imported session data across multiple ecosystems. Visit Dialed Golf to turn hybrid yardages into a measured, repeatable gapping reference.