

A golfer with a 92 mph driver speed may see one chart recommend a soft ball and another point to a firmer model. Start with the speed band, then check whether each ball's compression rating was measured on a comparable scale. Use the resulting range to shortlist balls, then confirm the fit with shots on the range.
Compression is a useful first filter, not a verdict. The rating describes how much a ball deforms under a test load, and differences in measurement methods can make numbers look comparable when they are not. A shortlist should account for the golfer's speed, the ball's construction, and how it performs across the bag.
Table of Contents
- Compression Ranges by Swing Speed and Player Type
- How Compression Ratings Are Measured and Why Scales Differ
- Ball Construction and Which Numbers Compare
- How Each Compression Band Feels and Launches
- Temperature and Construction Changes That Move the Numbers
- Reading Compression Charts Across Brands and Sources
- How to Test a Compression Shortlist on the Range
- Symptoms, Decision and Next Step
Compression Ranges by Swing Speed and Player Type
| Driver speed | Compression band | Typical player profile | Starting point |
|---|---|---|---|
| Under 70 mph | 30-50 | Beginners, juniors, many older golfers | Lowest bands; confirm carry and feel first |
| 70-85 mph | 50-70 | Moderate-speed amateurs wanting soft feel | Soft-to-moderate balls; check iron stopping |
| 85-95 mph | 70-85 | Mid-speed players needing balance | Mid-compression balls; check driver spin |
| 95-105 mph | 85-95 | Fast amateurs and low-handicap players | Firmer mid balls; check wedge control |
| 105 mph and above | 95-110 | Elite and tour-level speeds | Firm, tour-style balls; check mishit forgiveness |
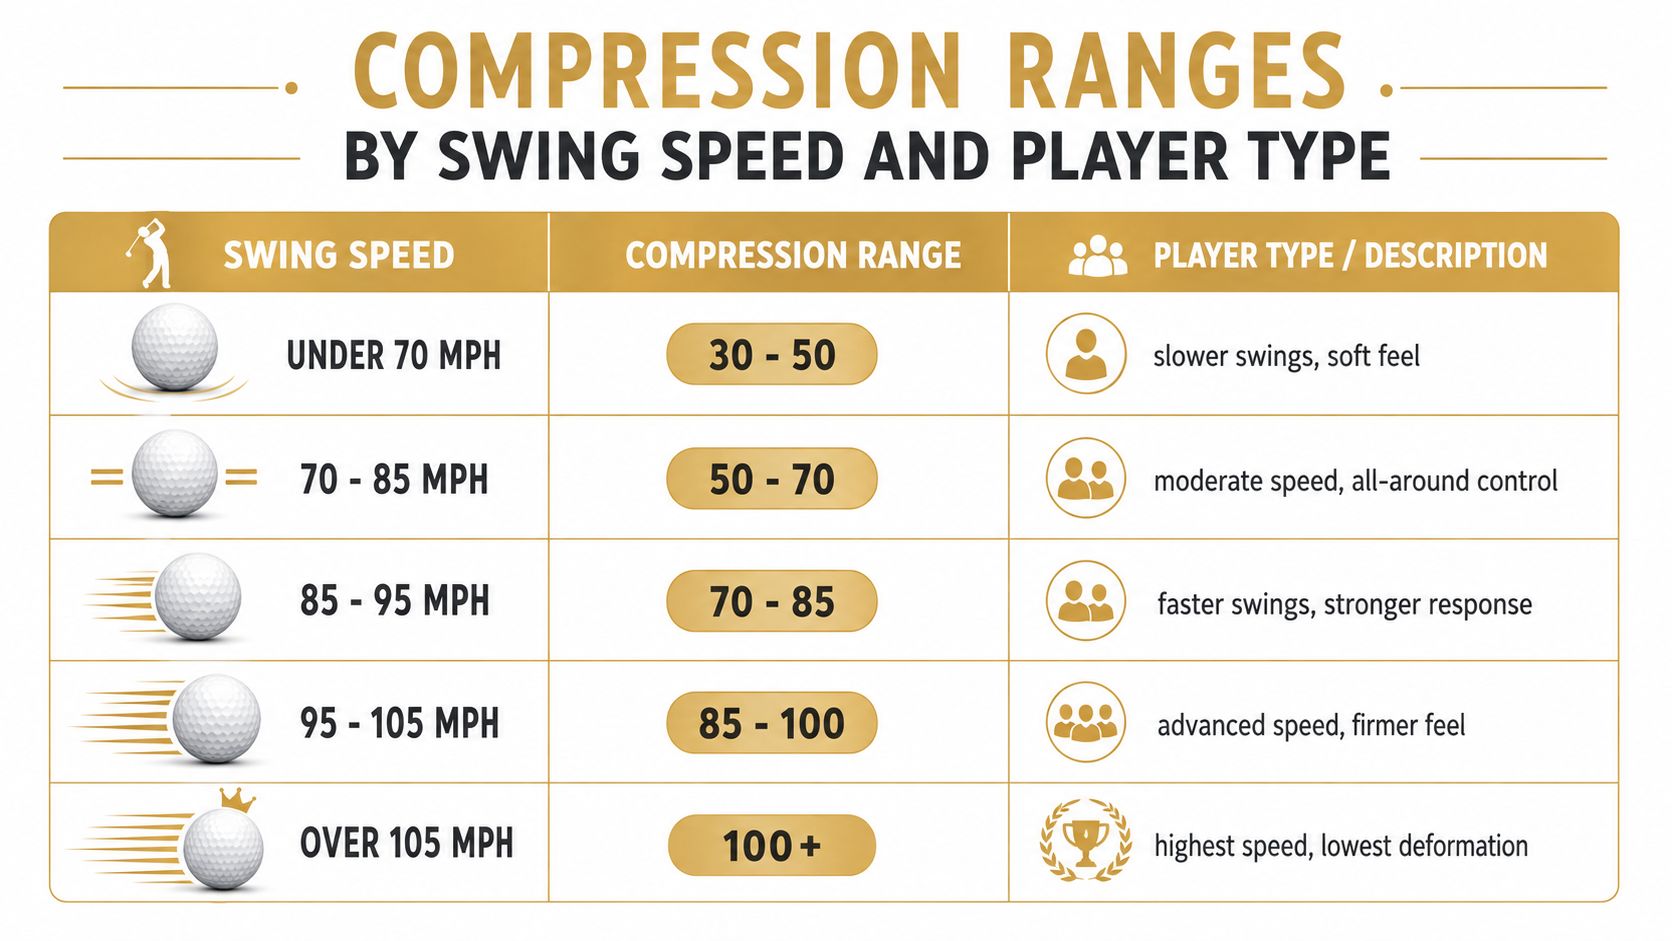
These driver-speed cut points are a working screening framework, not fitted thresholds. The compression bands follow the starting ranges described in the GolfSource compression guide, which emphasizes performance objectives rather than a single ideal rating.
The visual offers a quick orientation, although its upper-speed categories are broader than the narrower screening bands in the table.
What the player profiles actually mean
The lowest-speed group gives beginners, juniors, and many older golfers somewhere practical to start when easy deformation and a soft sensation matter. Age alone doesn't establish the category, however. An older golfer with a fast driver belongs in the measured-speed band, not an age-based assumption.
Moderate-speed amateurs can begin with softer constructions while paying close attention to approach shots. A comfortable impact sensation isn't enough if the ball doesn't provide useful iron height and predictable stopping.
Mid-speed players should look for a workable balance across the bag. The relevant question isn't whether a ball feels perfectly medium. It's whether the golfer can produce efficient drives without sacrificing approach control or short-game predictability.
Faster amateurs and low-handicap players can start with firmer candidates, but handicap doesn't measure speed. A technically skilled player with a compact swing may belong elsewhere in the table.
At elite speeds, firm, tour-style constructions provide a useful starting category rather than an automatic recommendation. Mishit performance still deserves attention, especially when a strong centered strike hides a candidate's less useful results elsewhere on the face.
How a golfer should read a row
The golfer should measure driver clubhead speed, not substitute ball speed or a best-ever distance. The driver ball speed chart guide helps distinguish the speed of the club from the speed of the ball leaving the face.
The practical sequence is straightforward:
- Measure normal swings. Use representative shots rather than the fastest swing of the session.
- Select a starting band. Keep the neighboring category available when ordinary swings sit near a boundary.
- Shortlist a few candidates. Include different constructions or cover options only when their differences are recorded.
- Confirm the shortlist with shots. Judge driver efficiency, iron flight, and partial-wedge response together.
A player near a boundary doesn't suddenly need a different ball when club speed moves slightly. Compression is a continuous scale, and the speed categories merely keep the initial search manageable.
Fitting principle: The band narrows the field. It doesn't choose the ball.
A useful shortlist also includes a reason for each candidate. One might offer a preferred impact sensation, another a promising approach flight, and another a useful comparison against the current ball. That makes the eventual test a decision about performance rather than a contest between printed ratings.
How Compression Ratings Are Measured and Why Scales Differ
Compression describes how much a golf ball deforms under a specified force. Lower readings generally indicate easier deformation; higher readings indicate greater resistance. The number describes a mechanical response, not the ball's overall performance.
The test procedure shapes the result. A method used consistently within one testing system does not automatically match the methods used by other manufacturers or laboratories.
The golf-ball compression testing patent describes ratings used since the 1940s, including the traditional comparison of 100 as harder than 90 and a documented relative system extending from 80, softest, to 160, hardest.
| Scale | Typical range | How to read it |
|---|---|---|
| Traditional scale | 90 and 100 compared directly | Higher number reads harder; use only within one source |
| Documented relative testing system | 80, softest, to 160, hardest | Relative scale; don't merge with consumer numbers |
| Modern consumer charts | Varies by chart and test method | Lower readings generally indicate easier deformation |
These are different ways of reporting results, not steps on a shared ruler. There is no conversion formula in the table: combining ratings from different scales can make a comparison look more precise than it is.
Why apparently identical ratings can disagree
Manufacturers and testers may use different devices and procedures. Two balls with the same printed rating therefore may not respond identically.
For example, a golfer might find that one ball feels softer off a wedge while another produces a different driver flight. Cover and internal layers affect those shots in different ways, so a matching label cannot describe every aspect of impact.
A compression rating is not a requirement of the Rules of Golf administered by the USGA and R&A. A conforming ball can have no published compression number, and the absence of one does not establish poor quality.
What the number can safely establish
Use a compression figure to understand how a ball responds within the scale and test procedure that produced it. The number can help describe relative firmness; it cannot, by itself, predict a golfer's complete experience.
The most useful chart identifies where each rating came from. Without that context, a number can imply a level of precision the comparison does not support.
Ball Construction and Which Numbers Compare
A golfer should sort the shortlist by construction before comparing compression figures. A rubber-core ball with an outer cover isn't mechanically identical to a wound design, even when a chart places their ratings beside each other.
The Encyclopedia.com account of golf-ball manufacturing describes two-piece designs by the early twentieth century, modern three-piece designs with an intermediate layer, and the arrival of Surlyn ionomer and newer urethane blends in the mid-1960s. Those material developments help explain why a single firmness number can't describe the entire ball.
Separate core response from cover response
The core, intermediate layers, and cover contribute different parts of the impact response. A golfer who dislikes the sensation of a short chip shouldn't automatically blame the core's compression.
Cover material deserves its own column in a comparison sheet. Ionomer and urethane constructions can provide different sensations and short-shot responses, even when their whole-ball firmness readings are close.
The historical distinction also needs care. The manufacturing account discusses compression ratings for compression-molded and wound balls, while describing a rebound-related measure for two-piece balls. That doesn't mean modern two-piece products can never receive laboratory compression measurements. It means a legacy rebound measure shouldn't be treated as interchangeable with a compression reading.
A practical comparison order
- Identify the construction. Record the layer arrangement and cover material from the packaging or manufacturer specification.
- Identify the measurement. Establish whether the entry describes finished-ball compression, a historical rating, or a rebound-related property.
- Compare like with like. Prefer the same construction category and measurement source before drawing conclusions from small numerical differences.
A golfer seeking a soft-feeling multilayer ball should therefore inspect the cover and construction, not choose the lowest rating. The right comparison is between documented products measured consistently, not between isolated numbers stripped of their context.
How Each Compression Band Feels and Launches
| Compression band | Feel | Launch and spin tendency | Watch for |
|---|---|---|---|
| 30-50 | Very soft and quiet | May launch higher; spin can rise at lower speeds | Ballooning or possible speed loss with an excessively soft construction at fast swings |
| 50-70 | Soft to moderate | Often a balanced launch; may provide useful iron stopping | Short-game response may feel less distinct to some players |
| 70-85 | Medium | Often a mid launch, with a balance of distance and control | Check driver spin for the specific model |
| 85-95 | Firm | May produce lower launch and driver spin for some faster-swing players | Check chip feel and short-game response |
| 95-110 | Firmest | Tends toward the lowest launch and spin in this screening model | Check mishit performance at moderate speeds |
Use the table to form a shortlist, not to predict a ball's flight from compression alone. The feel column helps identify sensations you may prefer; the other columns flag performance questions to test.
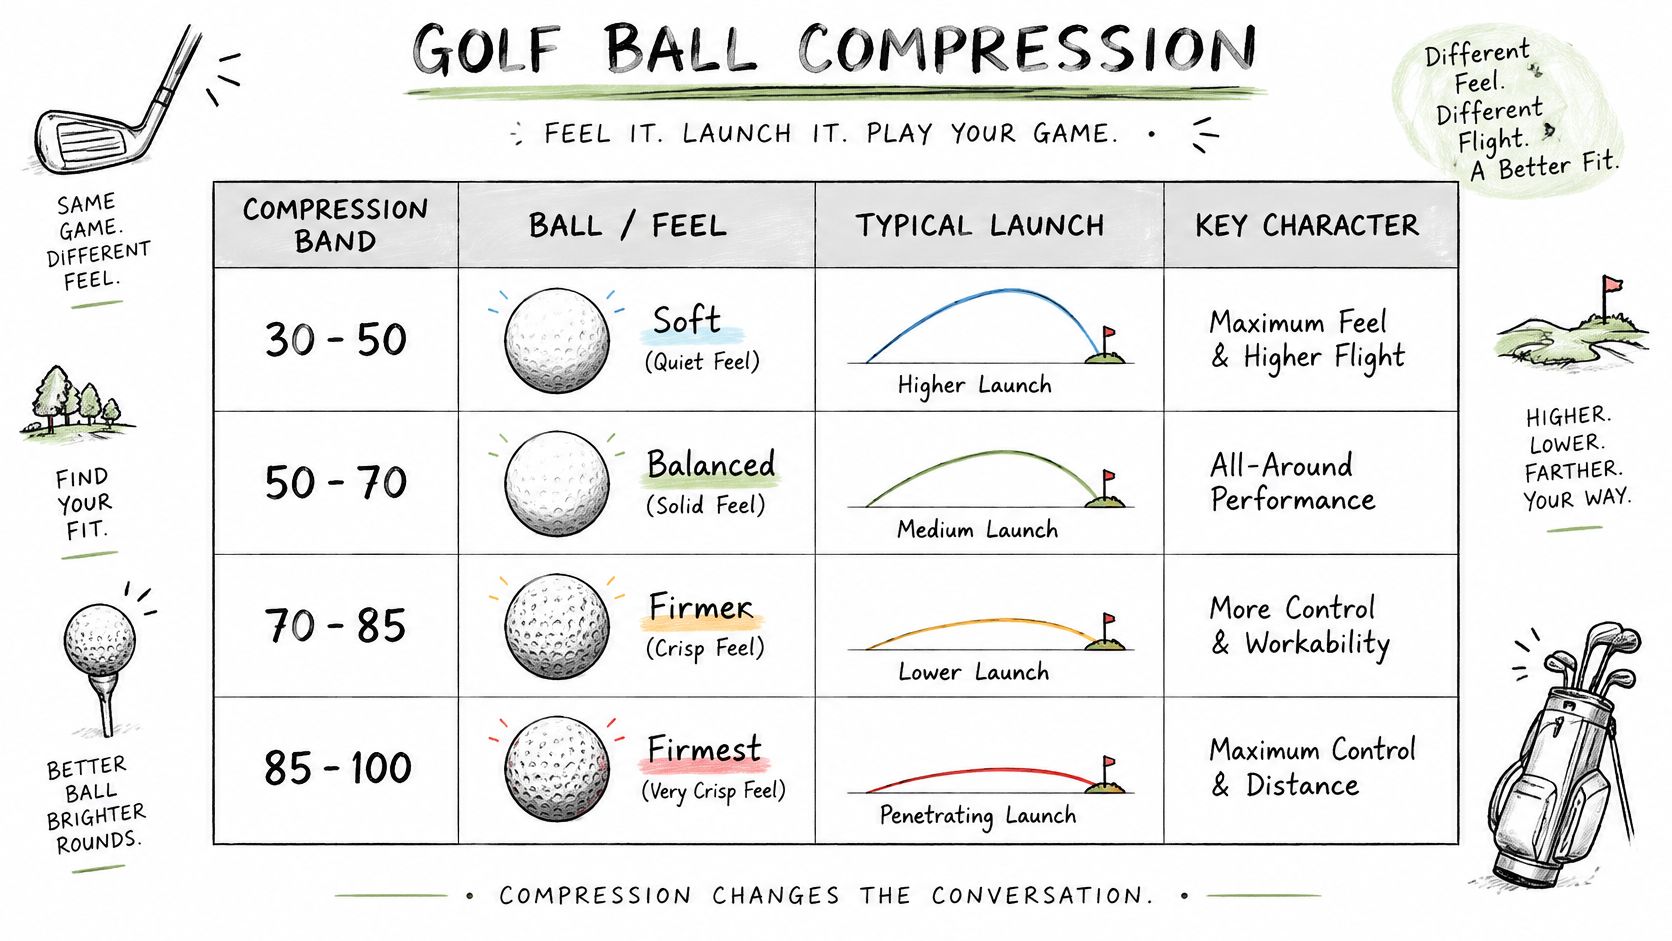
Feel is useful, but it isn't a launch measurement
Feel and flight are separate observations. Core architecture, mantle stiffness, cover material, impact location, club delivery, and temperature can all affect launch, spin, and distance, so balls with similar firmness may fly differently.
In its analysis of compression and swing speed, MyGolfSpy describes a strong but gradual relationship across approximately 85-115 mph, rather than a sharp point where one rating becomes correct. The analysis discusses potential benefits from firmer balls for some slower players and possible speed loss with excessively soft constructions for very fast players.
A related video provides additional context for evaluating compression claims.
Give each tendency a measurable check
A soft feel can be a useful preference, but confirm that the candidate holds up against alternatives in driver ball speed and carry. For a firmer-feeling candidate, check iron height, wedge spin, and distance control.
- Driver flight: Compare launch, spin, carry, and dispersion, not impact sound.
- Iron performance: Check whether the flight reaches useful height and provides the stopping behavior you want.
- Wedge response: Assess spin and repeatability alongside feel.
- Mishits: Include representative off-center strikes instead of judging only the best contact.
A towering shot can result from added dynamic loft, strike location, or delivery. It does not identify compression as the cause by itself.
Use your own driver and iron speeds when testing. Treat each band as a starting hypothesis, then keep the models that produce the shots you want.
Temperature and Construction Changes That Move the Numbers
A compression rating describes a ball under specific test conditions. Storage and playing temperature can change how it behaves, so a rating alone cannot predict its performance on a cold morning or after sitting in a hot vehicle.
Documented temperature effects
The MyGolfSpy examination of soft-feel ball claims reports that one hour at 115°F reduced compression by more than 15 points, while six hours in a freezer changed compression by only 2–3 points. The frozen balls nevertheless lost more than 6 mph of ball speed and gained nearly 500 rpm of spin.
Those results show why firmness readings alone can miss changes in play. A golfer cannot reliably convert the outdoor temperature into a replacement compression rating.
Why fast swings don't settle the soft-ball question
Compression and rebound are different measurements. A ball's rebound behavior does not, by itself, describe its launch, spin, carry, or dispersion.
That distinction matters when comparing claims about soft balls and fast swings. A result about rebound should not be treated as a complete performance verdict or compared as though it were the same measurement as a compression rating. Use the temperature and construction conditions attached to each result to understand what it describes.
For a range test, keep shortlisted balls in comparable storage conditions. Avoid deliberately heating or freezing candidates, and note changes in weather between sessions. Log the temperature and ball age each time. That record helps separate a change in conditions from a change in the golfer's swing.
Reading Compression Charts Across Brands and Sources
Can two compression numbers be compared fairly? Only when the testing method, ball preparation, and rating convention are sufficiently similar. A chart can help narrow choices, but a number without its testing context is like a temperature reading without a scale.
What a useful chart entry contains
The Today's Golfer equipment testing guide describes independent testing that pre-conditions balls for the Mullins effect, applies repeated force cycles, and measures controlled deformation. The guide reports testing 18 balls per model across 1,116 trials. Because preparation and loading procedures can differ, figures from separate systems should not be treated as directly interchangeable.
Pre-conditioning matters because repeated loading can change how a material responds. If a chart omits preparation and test details, a small difference may come from the procedure rather than the ball.
A useful compression-chart entry gives the reader:
- Published rating: The headline value associated with the model.
- Observed range: The spread of measured results, when available.
- Sample size: How many balls were tested.
- Test protocol: Preparation, loading, deformation measurement, and equipment.
- Rating origin: Whether the figure comes from a manufacturer or independent testing.
- Model identity: The exact ball and generation tested.
Nominal compression is the headline rating. Observed compression describes results from a sample under a stated method. An average can conceal variation between balls.
Read measured examples without merging them
In its 2025 testing, Today's Golfer reported TaylorMade results from 50 compression for SpeedSoft to 117 for TP5x, using 18 balls per model across 1,116 compression trials. These figures show the range within one brand, measured under that testing procedure.
Separately, MyGolfSpy measured the Snell Prime 3.0 at an average compression of 87 in 2024, placing it in the firm category. That result belongs alongside readings from the same laboratory method, rather than in an unqualified ranking assembled from unrelated charts.
Small gaps between sources may reflect different procedures or sample variation, not a meaningful fitting advantage. Keep manufacturer ratings distinct from laboratory measurements.
Use figures from the same source and method for direct comparisons. When methods differ, treat ratings as a rough filter: build a shortlist, then confirm the candidates through measured shots. Charts and fitting estimates can guide a choice, but they cannot guarantee performance.
How to Test a Compression Shortlist on the Range
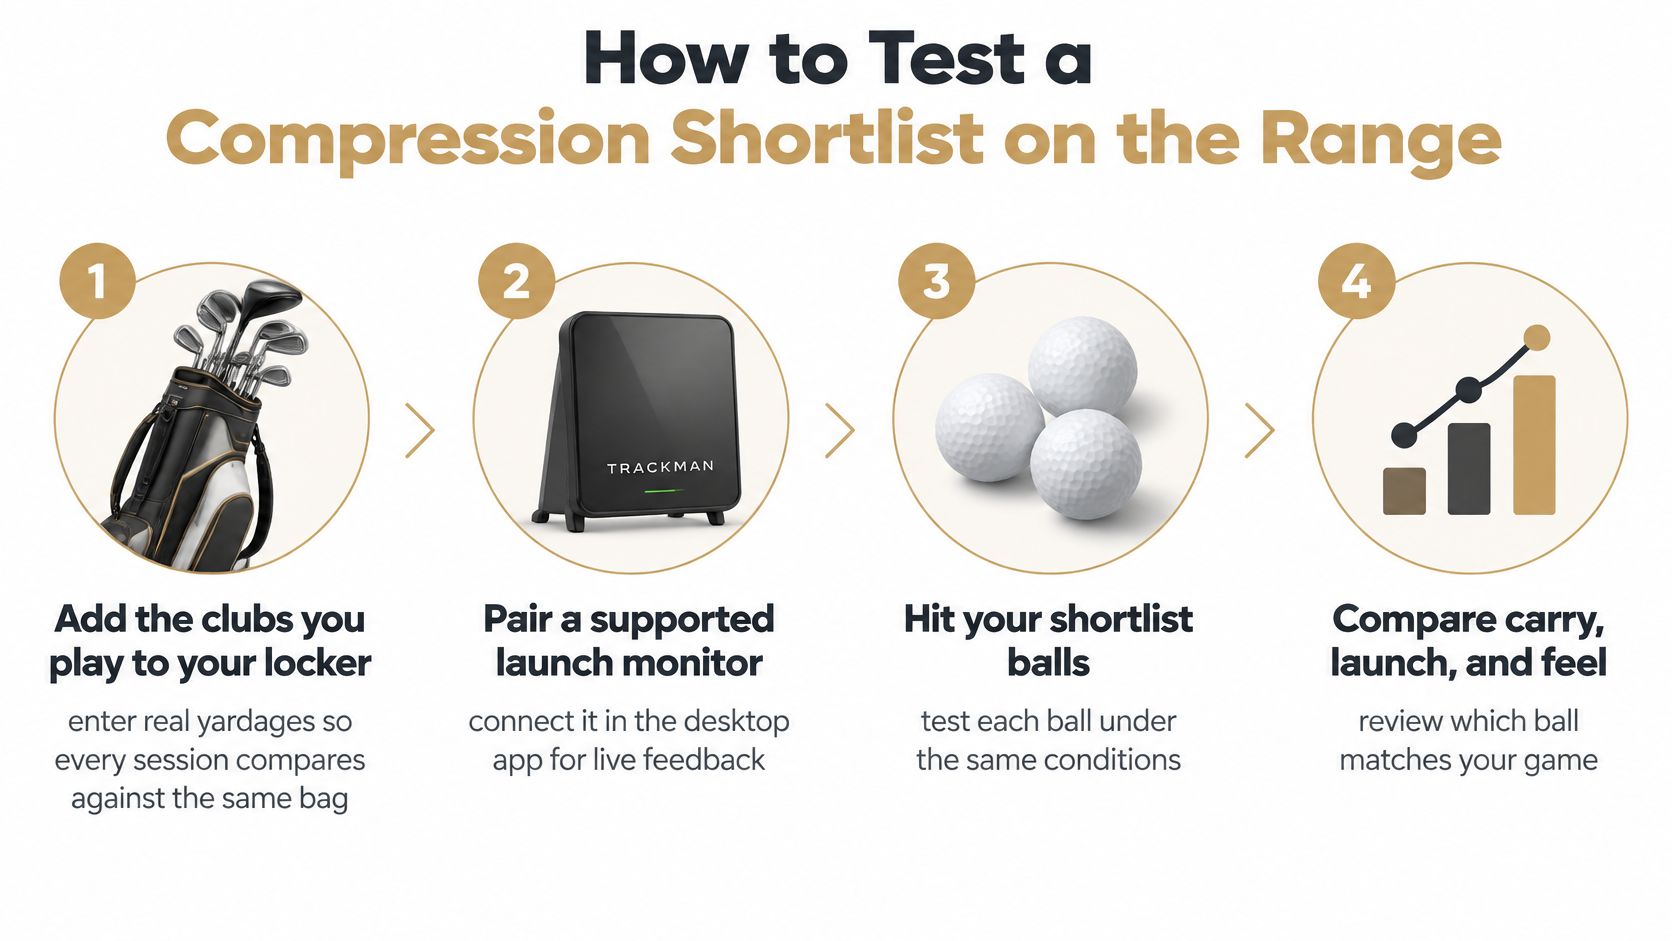
A fair range test follows four stages: set a baseline, capture comparable shots, record results, then retest. Each candidate needs the same clubs, conditions, and measurement settings.
Keep the comparison controlled
Add the clubs played to the locker. Enter representative yardages to establish a consistent baseline. Use typical carry, not the longest shot you remember; an outlier makes later comparisons less useful.
Pair a supported launch monitor or import a recorded session. Live capture can record shots locally for review, while an imported session works for practice recorded elsewhere. Check that the monitor captures the measurements you need. The guide to choosing a launch monitor for the driving range can help you assess the setup.
Hit each candidate with driver, mid-iron, and partial wedge. Continue until a pattern emerges, and label each block so the ball identities stay clear. One excellent strike cannot represent a candidate, and mixed-up balls make the comparison unreliable.
Record performance and feel separately. Track carry, total distance, dispersion, launch angle, and spin rate with the same monitor settings. Total distance can look appealing while carry or approach stopping gets worse, so judge each measure on its own.
Repeat under typical playing conditions. Note temperature, ball age, surface, and whether measurements are indoor or outdoor. A fresh candidate and a visibly worn one are not a fair pair.
Compare club by club before choosing an overall winner. Weigh driver efficiency, iron height and stopping power, wedge response, and directional consistency against the golfer's needs. One distance average can conceal a weakness with a scoring club.
Retest after a few weeks. Keep the bag, target lines, and recording approach consistent. A preference that holds across sessions is more useful than a result from one unusually good day.
Preserve the evidence behind the decision
Keep representative misses in the record. Exclude obvious capture errors, but do not remove ordinary off-center contact just because it weakens a preferred candidate.
Session note: Record one benefit and one trade-off for the shortlist winner.
For example, one candidate may improve driver consistency while leaving wedge response unchanged. Another may help approach shots stop sooner but feel firmer on the putter.
The result should be a shortlist winner with club-specific notes. That gives the golfer a clearer basis for buying and preserves enough context to understand whether a later change reflects the ball or the session.
Symptoms, Decision and Next Step
| Symptom | Likely cause to investigate | Fix to test |
|---|---|---|
| Ball feels harder than expected | Ball sits above the starting speed band, or its cover responds differently | Step down one band and retest |
| Ballooning, high spin, lost distance | Construction may not suit the fit, or the ball may be cold | Test a firmer band at room temperature |
| Low iron launch, too little height | Ball may be too firm for the current fit | Try a softer band and compare iron carry |
| Distance drops after hot storage | Heat may have changed the ball's response | Let it return to a stable temperature, then retest |
| Numbers change between sessions | Temperature, ball age, or test conditions may differ | Record conditions, use comparable balls, and retest |
Treat these as diagnostic clues, not diagnoses. A hard feel does not prove that swing speed is too low, and low iron flight alone does not establish that a ball is too firm.
Before changing compression bands, reproduce the complaint with candidates in the same band. If the symptom persists across them, check strike location and club delivery before buying another category.
Separate a ball problem from a swing problem
High-spin drives with every candidate point toward delivery as well as ball choice. Inconsistent iron height across all candidates makes contact and delivered loft worth checking before blaming the printed compression rating.
Change one main variable at a time. If the ball, club setting, tee height, and swing intention all change together, the test cannot show which change helped.
Use this decision order:
- Start with measured driver speed. Keep candidates from neighboring bands in play near a boundary.
- Set a clear goal. Choose whether carry, approach stopping, wedge response, or feel matters most.
- Compare club by club. Record results rather than relying on memory.
- Repeat the test. Confirm that the improvement holds in another session.
- Choose the overall fit. The best ball need not have a rating closest to the middle of a category.
The launch-monitor app guide explains how practice shots can be organized into a session record.
Dialed Golf's free Golf Ball Fitter finds a ball profile suited to a golfer's flight and feel, while its Carry Distance Chart Generator builds a printable reference for trusted clubs. These tools can narrow the candidates; a consistent range test should decide among them.
A shortlist is ready for a buying decision when it has a repeatable result and a clear trade-off. If no candidate improves the symptom, return to the swing or test conditions rather than treating compression as the only explanation. All recommendations and analytics are informational estimates, not guarantees of performance.