

A golfer finishes a range session with a familiar problem. The driver appears fast enough, the irons sometimes fly well, and the current ball feels acceptable, yet tee shots, approach shots, and short-game shots don't seem to belong to the same performance profile. The ball that produces a satisfying driver number may launch poorly with an iron or release too far on a pitch.
That's why choosing golf balls for average swing speeds requires more than a distance claim. A driver speed near the middle of the recreational market still leaves important questions about compression, spin, launch, descent, strike quality, and short-game control. The useful comparison is not only which ball travels farthest. It's which construction produces the most playable combination across the clubs that determine scoring.
Table of Contents
- Understanding Golf Ball Performance for Average Swing Speeds
- Key Criteria for Selecting Golf Balls for Average Swing Speeds
- Comparison of Popular Golf Ball Categories for Average Speed
- Real-World Scenarios for Average Swing Speed Golfers
- Testing Methodology Using Launch Monitor Metrics
- Recommendations for Golf Balls at Average Swing Speeds
Understanding Golf Ball Performance for Average Swing Speeds
A mid-handicap golfer testing several balls at the range may see only small differences in driver carry. The more revealing changes often appear elsewhere, such as a different launch window with a long iron, a different descent angle into a green, or a different release pattern after a wedge lands.
That makes generic ball comparisons incomplete. Driver distance matters, but it shouldn't decide the purchase if the ball leaves approach shots too flat or offers too little control around the green. Recent robot testing reinforces this broader view by comparing multiple speeds and clubs rather than treating one driver number as the entire golfer profile. A driver ball-speed reference can help establish a baseline, but the final decision should include approach and short-game evidence.
Practical rule: The right ball is the one that keeps the driver playable while preserving useful launch and stopping behavior with scoring clubs.
The working framework is straightforward. First, estimate or measure driver speed. Next, identify a compression neighborhood, then test driver spin and launch against iron carry and descent. Finally, weigh feel and greenside behavior against the golfer's usual miss.
This approach treats the ball as part of a complete performance system. It also gives golfers a repeatable way to test alternatives rather than switching whenever a new model appears on a shelf.
Key Criteria for Selecting Golf Balls for Average Swing Speeds
A golfer with an average driver speed can find two balls equally acceptable off the tee yet see a clear difference with a seven-iron or wedge. The useful choice therefore depends on three connected variables: compression rating, spin performance, and launch characteristics. A ball can match a speed range on paper while producing a flight that carries poorly, descends too shallowly, or gives up control around the green.
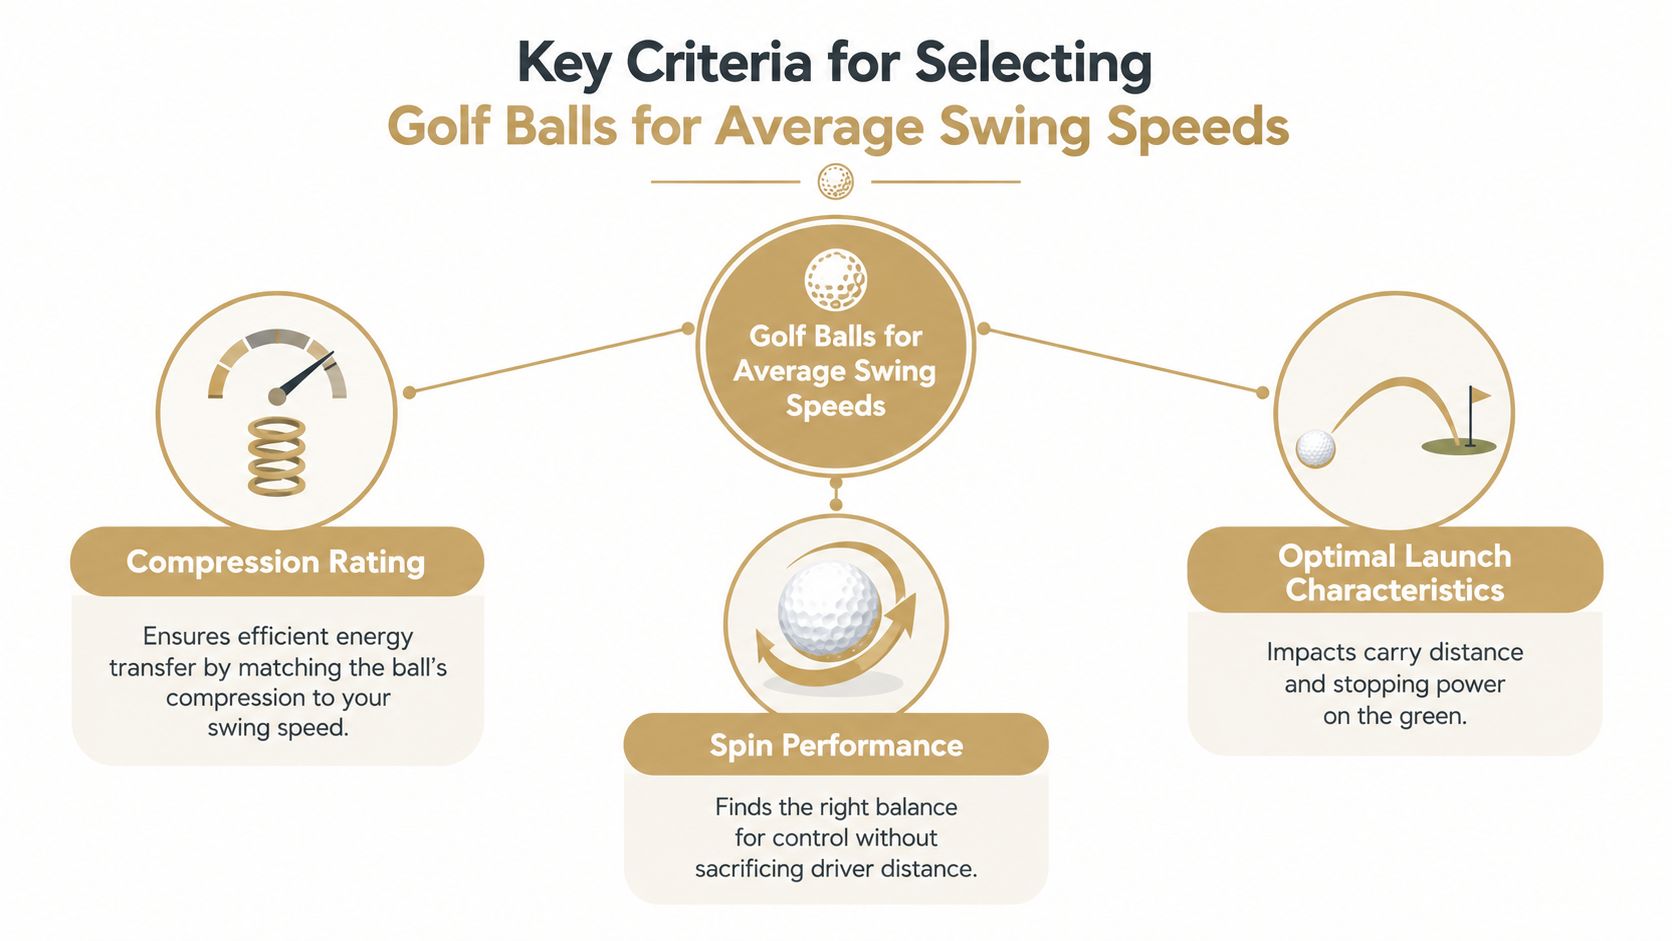
Compression should identify the neighborhood
Average driver speed commonly sits near 93 mph, while industry references place many typical male amateurs in the 90–95 mph band and cite an overall average of 93.4 mph. The speed-based compression chart places golfers under 85 mph in a low-compression group, golfers from 85–100 mph in a mid-compression group, and golfers above 100 mph in a high-compression group.
The same chart suggests approximately 65–90 compression for the 85–100 mph range, roughly 30–70 for players below 85 mph, and 90–115 above 100 mph. These bands work as a starting point, not a final verdict. Actual delivery, contact quality, and the golfer's preferred feel can shift the practical choice.
Compression describes a fitting neighborhood. Construction determines much of the behavior inside that neighborhood. Two balls with similar compression can separate differently between driver, iron, and wedge shots because their layers and covers influence feel, spin separation, and approach control.
Spin must be judged by club
For a golfer near the average driver-speed range, a practical driver benchmark is approximately 85–105 mph. Robot-tested guidance places a useful driver spin window around 2,200–3,000 rpm, while other launch-monitor guidance identifies roughly 2,000–2,700 rpm as a common distance-optimization range for this population. The robot-tested average-speed guidance supports a balanced target rather than an automatic preference for the lowest possible spin.
Very low driver spin can flatten the flight, especially when launch is also limited, and reduce carry. Excessive spin can produce a high, unstable flight that gives up forward movement. The relevant test is whether the ball keeps a controllable trajectory while maintaining a useful relationship between carry and total distance.
Iron and wedge spin require separate checks. A ball that reduces driver spin may still need adequate cover interaction and layer design to produce predictable approach and greenside behavior. Driver-only testing can therefore favor a ball that looks efficient from the tee but leaves poorer scoring conditions.
Launch affects carry and stopping power
Driver launch guidance for this speed group generally centers around 12–16°, interpreted alongside the applicable spin range. A launch that is too low can limit carry, while high launch paired with excessive spin can send the ball upward without adding useful distance.
Iron launch matters just as much. A golfer with inconsistent contact may benefit from a ball that preserves height on imperfect strikes. A balanced urethane or soft-ionomer construction can suit changing strike quality better than a highly specialized low-spin design.
A useful monitor session should record:
- Driver launch and spin, to see whether the ball stays inside a controllable window.
- Driver carry and total distance, to distinguish useful flight from rollout.
- Iron carry, to check whether the ball preserves predictable gapping.
- Descent and stopping behavior, to determine whether approach shots remain playable.
- Wedge response and feel, because scoring performance continues beyond the tee shot.
Test each ball with the same club setup, target, weather conditions, and strike routine. Golfers using a personal monitor can review the wider role of measurement through a launch-monitor app for structured practice. Compare the driver and iron results together, then choose the ball that keeps both parts of the game within workable windows.
Comparison of Popular Golf Ball Categories for Average Speed
A golfer with average speed can face two different needs in the same round: a driver flight that retains useful speed and an iron flight that descends steeply enough to hold a green. Comparing ball categories helps identify which construction addresses that combination, rather than treating one ideal drive as the complete test.
A recent multi-speed robot test used 2,232 shots at 114 mph, 93 mph, and 84 mph, then examined mid-iron performance as well. The multi-speed robot test shows why average speed should be assessed across more than driver distance. Approach launch, spin, descent, and the effect of contact quality can change the practical value of a ball.
| Category | Compression Range | Typical Spin (rpm) | Launch Angle (°) | Best For |
|---|---|---|---|---|
| Mid-compression all-around | 65–90 | Balanced, commonly tested within the average-speed driver window | 12–16 | Golfers seeking a stable blend of distance, launch, and control |
| Low-compression soft-feel | 30–70 | Lower driver spin, with construction-dependent short-game response | Easier launch, often toward the higher side of the player's useful window | Slower or smoother swingers prioritizing launch and forgiveness |
| High-spin tour-style urethane | 90–115 | More short-game and approach emphasis, driver results depend on delivery | Player-dependent, with enough launch required to avoid a flat flight | Golfers prioritizing shaping, approach control, and greenside response |
| Performance-driven multi-layer | Varies by design, often speed-segmented | Separated driver and greenside behavior | Construction and delivery dependent | Golfers wanting distinct long-game and scoring-club performance |
Mid-compression all-around balls
Mid-compression all-around balls provide the clearest baseline for golfers near the market's average driver speed. Their purpose is to balance ball speed, driver control, approach height, and short-game response without heavily favoring one part of the bag.
That balance matters when strike quality changes. A ball that performs acceptably on centered contact and remains predictable on slight misses can produce more useful scoring results than one that wins only under ideal delivery. A golfer can use this category as the reference point for a launch-monitor comparison, then look for a specific reason to move softer, firmer, or more specialized.
Low-compression soft-feel balls
Low-compression designs suit golfers who need easier launch, softer impact feel, or more help when clubhead speed and contact quality fluctuate. They are most relevant near the lower edge of the average-speed group, where a firmer construction may produce a flatter flight or less useful carry.
The performance question is whether the easier launch creates enough approach control. A ball that gains height with the driver may still release too far after an iron shot if its approach response does not match the golfer's delivery. Players should therefore compare iron descent and stopping behavior with driver carry, rather than judging the category by feel or launch alone.
High-spin tour-style urethane balls
High-spin urethane designs target golfers who place greater value on approach control, shot shaping, and greenside feedback. They can suit a player whose main scoring loss comes from shots that fail to stop, even when driver distance is already adequate.
Their cover material does not settle the choice. If the golfer already creates excessive driver spin or delivers the ball with insufficient launch, this category may reinforce the problem. A controlled test should compare driver spin and carry with mid-iron launch, spin, descent, and landing behavior. The ball earns a place in the bag when its approach benefits outweigh any loss of tee-shot efficiency.
Performance-driven multi-layer constructions
Multi-layer balls distribute performance across different clubs. A core and inner layers may support driver speed and manageable spin, while the outer layers provide more suitable iron, wedge, and putting response.
This design is useful when the driver and approach requirements pull in opposite directions. A golfer may need less driver spin but still require enough iron spin and descent to hold a green. Multi-layer construction can reduce that compromise, although results still depend on strike, speed, launch, and delivery.
The meaningful comparison is which category keeps the most important shots inside a playable window. Average-speed golfers should not select a ball solely for its longest ideal drive. A small reduction in theoretical distance may be worthwhile if the ball produces more reliable iron flight, better approach stopping, and fewer difficult recovery shots. Combine robot-test evidence with repeated driver and iron readings from a personal launch monitor, then choose the category that improves the full performance pattern.
Real-World Scenarios for Average Swing Speed Golfers
An average-speed golfer can produce a workable driver flight yet lose strokes because iron shots launch too low, descend too shallowly, or stop inconsistently. Governing-body research cited in market releases places average swing speed at 93 mph for male golfers and 72 mph for female golfers, while other player groupings place many recreational male golfers around 85–95 mph and female amateurs around 65–75 mph. The cited research summary supports a practical conclusion: “average” describes a range, not one ball requirement.
The 93 mph golfer with a low-spinning approach flight
This golfer may produce acceptable driver distance but struggle to hold greens with mid-irons. A higher-spinning driver design is not automatically the answer. A balanced mid-compression or multi-layer construction may preserve tee-shot efficiency while giving approach shots more height and stopping behavior.
A launch monitor can separate low launch, insufficient iron spin, poor contact, and mixed delivery issues. Compare driver speed, launch, spin, and carry with mid-iron peak height, descent, and carry. If the driver already sits in a playable window, favor the ball that improves approach performance without making tee shots less predictable.
The 85 mph golfer seeking height
At approximately 85 mph, a golfer sits near the boundary between low- and mid-compression recommendations. A softer-feeling design may help when the current ball launches too low or loses carry on imperfect strikes.
Feel remains only one input. Keep the club, setup, alignment, and shot intention consistent, then compare carry, peak flight, and approach descent across several shots. If the softer category produces easier height while maintaining a stable driver flight, its value extends beyond comfort. It improves the relationship between tee-shot distance and approach-shot usability.
The golfer who values greenside control
Some golfers lose more shots around the green than off the tee. A urethane-oriented category may suit them even at average driver speed, provided driver spin remains controllable and the ball does not create excessive curvature.
The scoring test should include chips and partial wedges, not only full swings. A ball with acceptable tee-shot performance and predictable greenside response can produce more useful results than one selected for maximum driver carry alone. Record both driver and iron metrics, then confirm the choice with short-game shots that resemble on-course demands.
Course-fit principle: Match the ball to the golfer's dominant miss and scoring pattern, not only to the speed shown by a launch monitor.
Testing Methodology Using Launch Monitor Metrics
A useful ball test begins with a controlled scenario. The golfer should keep the same club, tee height, monitor position, alignment routine, and shot intention for every model. If several variables change together, the resulting numbers cannot show whether the ball caused the difference.
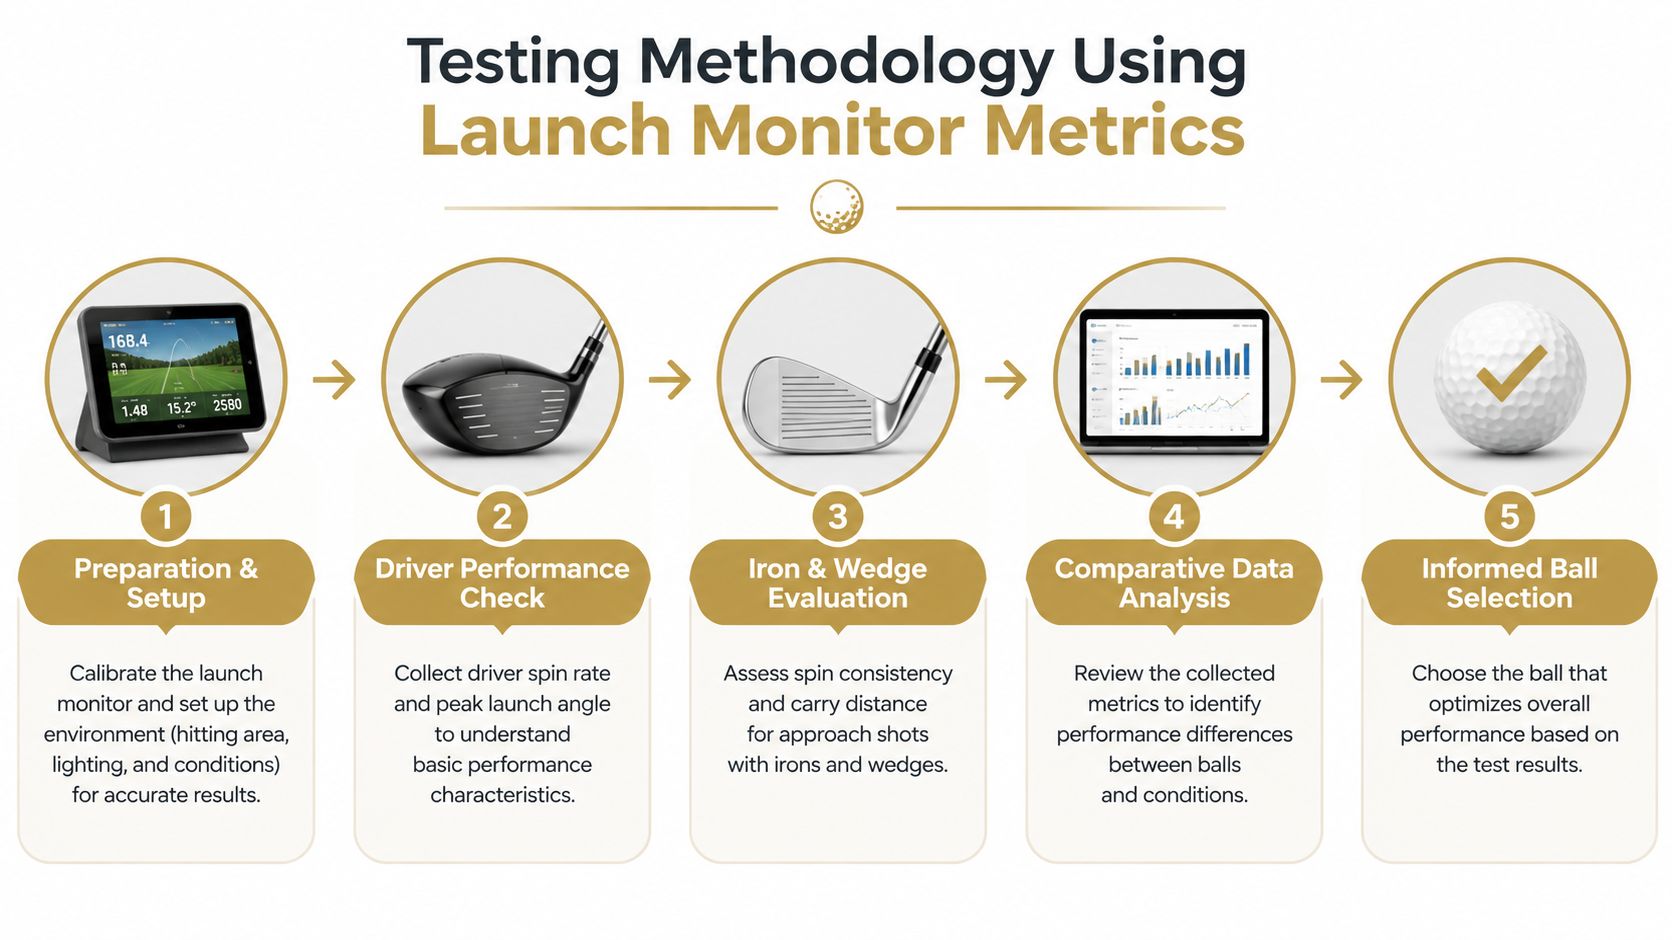
Step one starts with preparation
Set up the launch monitor according to its operating requirements. Keep the hitting area, target line, and ball position consistent. Before recording comparisons, hit enough shots to settle into the session and reduce the effect of early-session timing changes. Golfers choosing hardware can use this launch-monitor guide for driving-range practice to evaluate suitable measurement capabilities.
A control ball provides a reference for familiar results. It does not establish that the control ball is the correct choice. It helps reveal whether an unusual result came from the setup, delivery, or monitor rather than from the test ball.
Step two isolates driver performance
Record clubhead speed, ball speed, launch angle, backspin, carry, total distance, and dispersion whenever the monitor provides those fields. For average-speed players, the useful comparison is roughly 85–105 mph, with driver spin commonly assessed against a controllable 2,200–3,000 rpm window and launch near 12–16°. These figures establish a test range, not a universal fitting prescription.
A single longest shot is weak evidence. The stronger candidate produces a repeatable flight and maintains a sensible relationship between carry and total distance. Keep mishits in the record because average golfers do not reproduce centered contact on every tee shot. Comparing the distribution of results gives more useful information than selecting the best swing.
Step three adds irons and wedges
Driver-only testing can hide a ball's approach weaknesses. Use an iron that represents normal approach play, then record carry, launch, spin, peak height where available, and descent angle. The practical question is whether the ball creates useful gapping and enough landing angle for the golfer's usual course conditions.
Wedge testing should include partial shots and fuller swings. Feel remains relevant, yet launch-monitor results can show whether one construction produces more consistent carry and spin. A ball that feels good but creates wide distance variation may be less useful than one with a different feel and tighter outcomes.
Step four organizes the data
Log every shot with its ball category, club, intended shot, strike quality, and available monitor metrics. A CSV export preserves the raw session, allowing later review instead of relying on memory or one summary screen.
Compare groups rather than isolated outliers:
- Driver stability: Check whether launch and spin remain inside the golfer's useful window.
- Carry retention: Compare average-quality strikes with the same club.
- Approach behavior: Review iron launch, spin, carry, and descent together.
- Miss resilience: Identify which ball remains useful when contact changes.
- Scoring-club response: Examine partial wedges and chips through both data and feel.
A broad compatibility pattern supports CSV ingestion across many popular launch monitors and simulator systems. The important capability is not the brand list. It is whether the system can export consistent fields that allow driver, iron, and wedge results to be compared in one record.
Step five turns comparison into a decision
The final choice should follow the golfer's priorities. If driver spin is too high, test a construction that reduces it without making iron flight unusably flat. If approach shots fall short or release too much, give greater weight to launch and descent. If mishits dominate the round, carry retention and predictable dispersion may matter more than a perfect center-strike result.
Dialed Golf's desktop practice product supports a live pair beginning with a compatible launch monitor and expanding outward, together with CSV and import workflows. Its consumer app connects practice records with on-course use. The golfer can test several balls in a personal range or simulator environment, preserve the session data, and relate those findings to actual playing decisions.
The result is a more defensible fitting process. Driver metrics show whether the ball remains predictable from the tee, while iron and wedge metrics show whether that same ball supports approach and scoring shots. Keeping all three stages in one comparison prevents a ball from winning on distance alone while creating avoidable problems elsewhere in the round.
Recommendations for Golf Balls at Average Swing Speeds
For a golfer near 93 mph, mid-compression is a practical starting point. Commonly cited guidance places 85–100 mph players in the mid-compression category, with approximately 65–90 compression suggested in one chart. The compression guidance supports testing a balanced, multi-layer ball before moving to the softest or firmest construction.
Golfers below that range should compare launch, carry retention, and feel. Golfers above it should test whether a firmer, control-oriented design improves iron and greenside results without raising driver spin. A ball should earn its place through matched driver and iron testing, with partial wedges included. A strong driver result alone is insufficient if approach shots launch poorly or release unpredictably.
Dialed Golf connects course use through its TestFlight consumer app with desktop launch-monitor practice, live pairing, and CSV-based data import. Visit Dialed Golf lets golfers test several balls against their actual swing profile, preserve driver and iron results in one record, and make the next change from measured performance rather than marketing claims. The practical recommendation is simple: choose the ball that produces the most consistent trade-off across tee shots, approaches, and scoring shots.