

Most golfers trust the number on the sleeve and stop thinking there. That's the wrong starting point for 90 compression golf balls, because the printed number is not a universal performance promise, it's a relative firmness label that only means something inside the method used to measure it (Golf Monthly on compression and modern multi-layer construction). A better fit starts with ball speed, launch, spin, and dispersion, then works backward to the construction that produced them.
Table of Contents
- The Myth of the Universal Compression Number
- Impact Physics and High-Speed Energy Transfer
- Evaluating Tour-Level Models and Construction Tradeoffs
- Designing a Controlled Launch Monitor Test
- Accounting for Temperature and Manufacturing Variability
- Turning Range Data into a Definitive Gap Analysis
The Myth of the Universal Compression Number
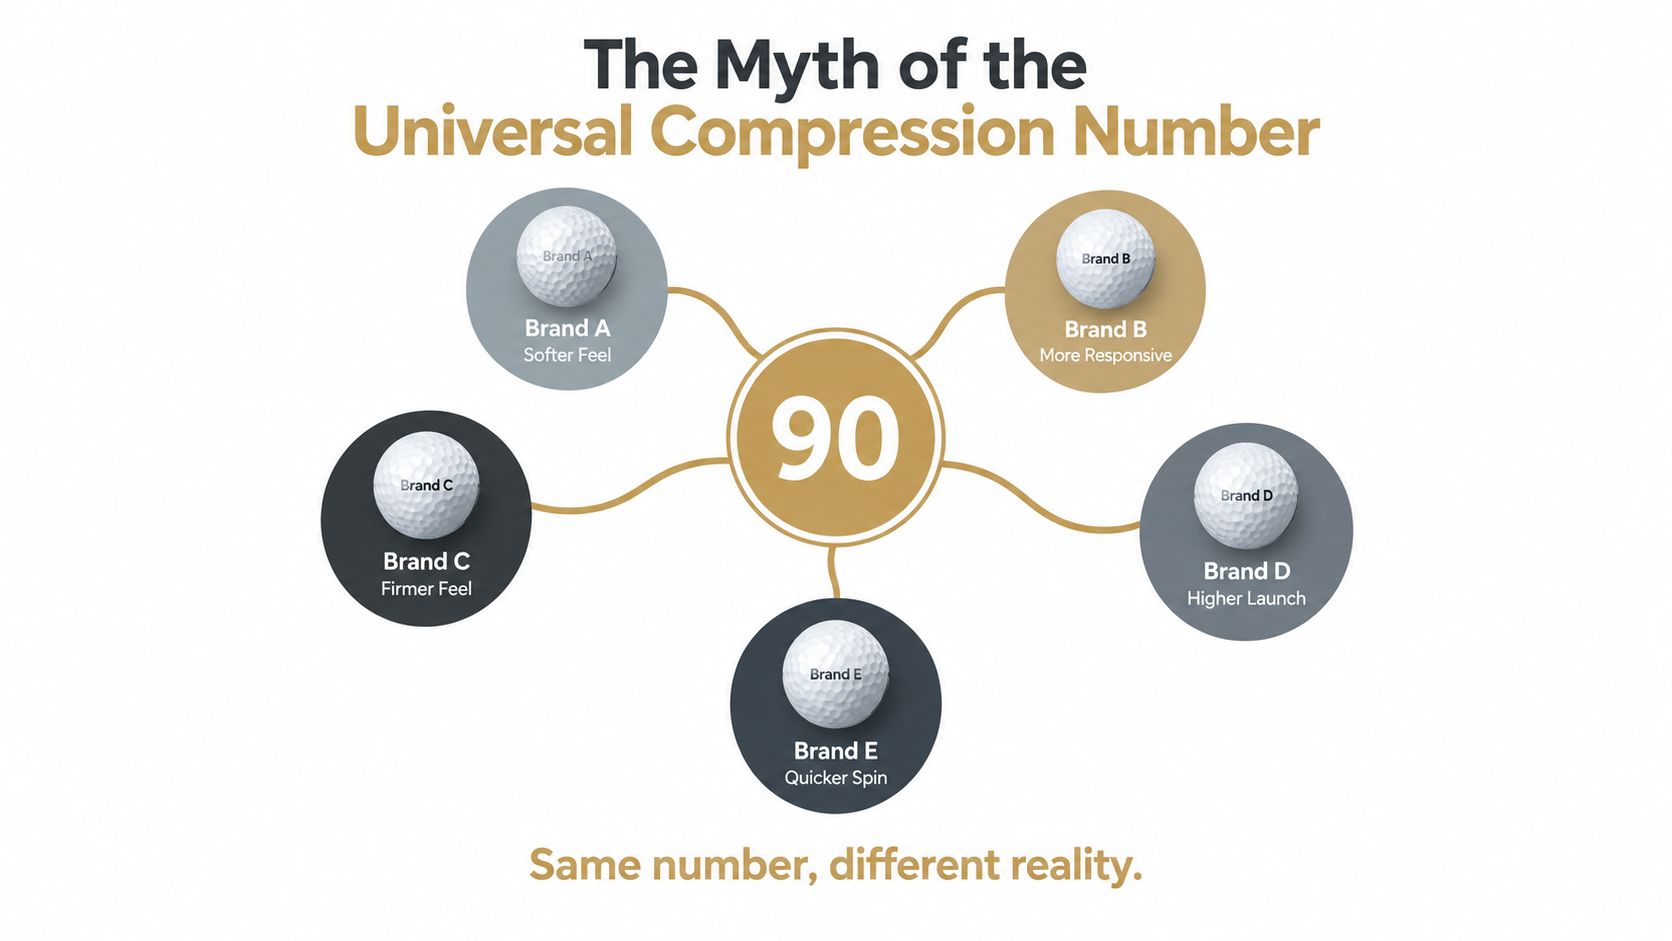
A 90-compression label sounds exact, but it is only a shorthand for a ball that resists deformation more than a softer model. Compression measures how much the ball deforms under load, and figures from different test methods are not always directly comparable (Golf Monthly on compression methodology and why figures are less often printed now).
What the number actually tells you
The label is most useful as a within-method comparison of firmness. Older retail scales often sat around an approximate 50 to 100 band, while modern designs can fall outside that range, so the printed number carries less meaning than it once did.
Practical rule: if two balls both say “90,” treat that as a clue, not a conclusion.
Construction changes the result. Modern balls use multiple cores, mantle layers, and covers, so two products with similar measured compression can still produce different feel, launch, and spin on the course. That difference matters most when you are comparing driver numbers against partial-wedge control, because the same label can hide very different response profiles.
The smarter filter is broader than the box score. Cover material, layer structure, launch, spin, and player swing speed matter at least as much as the compression number itself, especially when a golfer is trying to predict how a ball will behave off the driver and into partial wedges.
Impact Physics and High-Speed Energy Transfer
At impact, the ball compresses, stores energy for a split second, then rebounds. As inbound speed rises, maximum deformation increases while contact time and coefficient of restitution fall, which is why firmer constructions tend to suit faster swings (springer study on impact velocity, deformation, and restitution).
Why firmer balls suit faster swings
A firmer construction can hold more of the rebound efficiency when the strike speed climbs. USGA research, summarized in a ball-compression guide, reports that high-compression balls lose less coefficient of restitution as impact speed rises, which helps explain why stronger players often keep more ball speed off the driver (Forgeway summary citing USGA research).
That is the practical case for a 90-compression ball. It does not add distance by itself, but it can preserve more of the speed the player already delivers to the face when contact is solid and delivery is repeatable.
Why compression still doesn't decide distance
Ball speed is only one part of the result. Impact speed, strike location, launch angle, spin, temperature, and club delivery all shape the shot after contact, so compression is only one variable in the chain.
Dialed Golf's driver ball speed chart belongs here because it keeps the focus on observed output instead of label chasing. A player who tests a firmer ball and sees cleaner ball speed, tighter launch, and less scatter has a real fit signal. A player who sees worse contact quality has learned just as much.
That is why launch-monitor testing matters more than feel after one swing. Ball speed, launch, and dispersion tell the truth.
Evaluating Tour-Level Models and Construction Tradeoffs
A 90-ish ball usually sits in the firm, tour-style neighborhood, but the market does not match the number on the sleeve very cleanly. Independent measurements can differ from brand descriptions, so the better comparison is direct: compare balls on how they perform for this swing and these scoring shots, not on the number printed on the sleeve (Forgeway on measured compression differences and tour-style models).
What you give up and gain
The main tradeoff is high-speed stability versus impact feel. A firmer ball can hold up better off the driver when speed climbs, while a softer cover and mantle stack can make partial wedge shots feel less harsh and help greenside control.
For wedge play, compression alone does not decide short-game performance. Ball construction still shapes how the ball reacts on partial shots and around the green, so greenside spin has to be checked on its own.
| Ball Model | Advertised Category | Measured Compression | Best Suited For |
|---|---|---|---|
| Titleist Pro V1 | Tour-style ball | Around 92 to 92.5 | Players who want a firm-but-not-max-firm feel and balanced all-around performance |
| Bridgestone Tour B X | Tour-style ball | Around 98.5 | Faster swings that can fully load a firmer design |
The point is not that one number wins. The same compression band can still produce different feel, launch windows, and short-game responses. That is why a launch monitor session is more useful than a marketing description.
Designing a Controlled Launch Monitor Test
A useful ball test starts with one rule, remove everything you can except the ball. Keep the club, tee height, strike target, and environment as steady as possible, because ball comparisons fall apart when setup changes are driving the result.
A clean protocol isolates the ball, not the swing. Use the same club for the entire session, then sort shots into driver, mid-iron, and partial wedge. The ball that performs well across those groups deserves attention. The one that only wins on a perfect strike does not.
- Match the tee and setup: Keep tee height, alignment, and stance identical so delivery conditions stay consistent.
- Collect enough swings: Use several shots per model, then compare median outputs instead of the single best result.
- Track the right numbers: Prioritize ball speed, launch, spin, carry, and offline dispersion over total distance.
- Filter obvious mishits: A toe snap or heel strike says more about the miss pattern than the ball.
- Keep the club constant: One driver, one mid-iron, one wedge, no substitutions mid-test.
- Write down conditions: Temperature, wind, and whether the test happened indoors or outdoors all matter.
Any launch monitor that reports club-head speed, club-face angle, club path, angle of attack, ball speed, launch angle, launch direction, spin axis, spin rate, apex height, smash factor, carry distance, total distance, and deviation distance, with stated accuracy figures for speed, ball speed, launch, direction, and carry, is enough for this kind of comparison. A device that gives that full shot picture is more useful than one that only produces a single distance number. For a practical buying perspective on range use, this guide on launch monitors for range work is a useful companion to a controlled test.
That same logic applies whether the golfer is testing in a garage bay or outside on grass. The point is repeatable shot data, not the feel of one good swing.
Accounting for Temperature and Manufacturing Variability
Cold air changes the test. Rubber stiffens, the ball can feel firmer, and launch-monitor readings can shift even when the golfer thinks the swing is unchanged. Guidance commonly says compression rises as temperature falls, but the practical challenge is separating the ball's response from the golfer's own seasonal changes and the surrounding air.
Why winter comparisons go sideways
A nominal 90 can hide meaningful differences between individual balls or production batches, so two sleeves that look identical on paper may not behave the same once conditions change. That's why controlled testing now matters more than a label, especially when the player is trying to tell whether shorter carry came from the ball, the weather, or the swing.
A useful winter playbook is simple:
- Store balls consistently: Keep them in a stable place instead of letting one sleeve sit in the garage and another ride in a cold trunk.
- Warm them the same way: Use the same pre-round routine every time so temperature isn't an uncontrolled variable.
- Log ball temperature: Don't rely on memory when comparing sessions across different days.
- Compare the same shot types: Driver, mid-iron, and wedge numbers should be tracked separately.
- Watch the indoor-outdoor gap: Simulator readings can't be interpreted the same way as outdoor flight in cold air.
The clearest recent sign that this area is tightening up is independent robot testing that has expanded to more shots and more rigorous compression measurement, including model-level variability. That matters because a golfer doesn't need a perfect lab, but does need a repeatable method.
If carry drops in winter, don't blame the compression number first. Check the ball temperature, the air, and the swing before changing the ball.
Turning Range Data into a Definitive Gap Analysis
Raw shot data only becomes useful when it turns into a bag decision. That means exporting the session, sorting the numbers by ball type, and looking for overlaps or dead zones that a firmer or softer ball might be creating in the long game and scoring clubs.
From session file to on-course chart
A desktop workflow makes this easier because the golfer can import shot records, separate the useful swings from the outliers, and compare carry windows with much more discipline than a memory-based range session ever allows. Dialed Golf sits in that workflow as a desktop practice layer with live pair support first, plus CSV and import paths for launch-monitor data, while free web tools stay free and the paid layer remains separate.
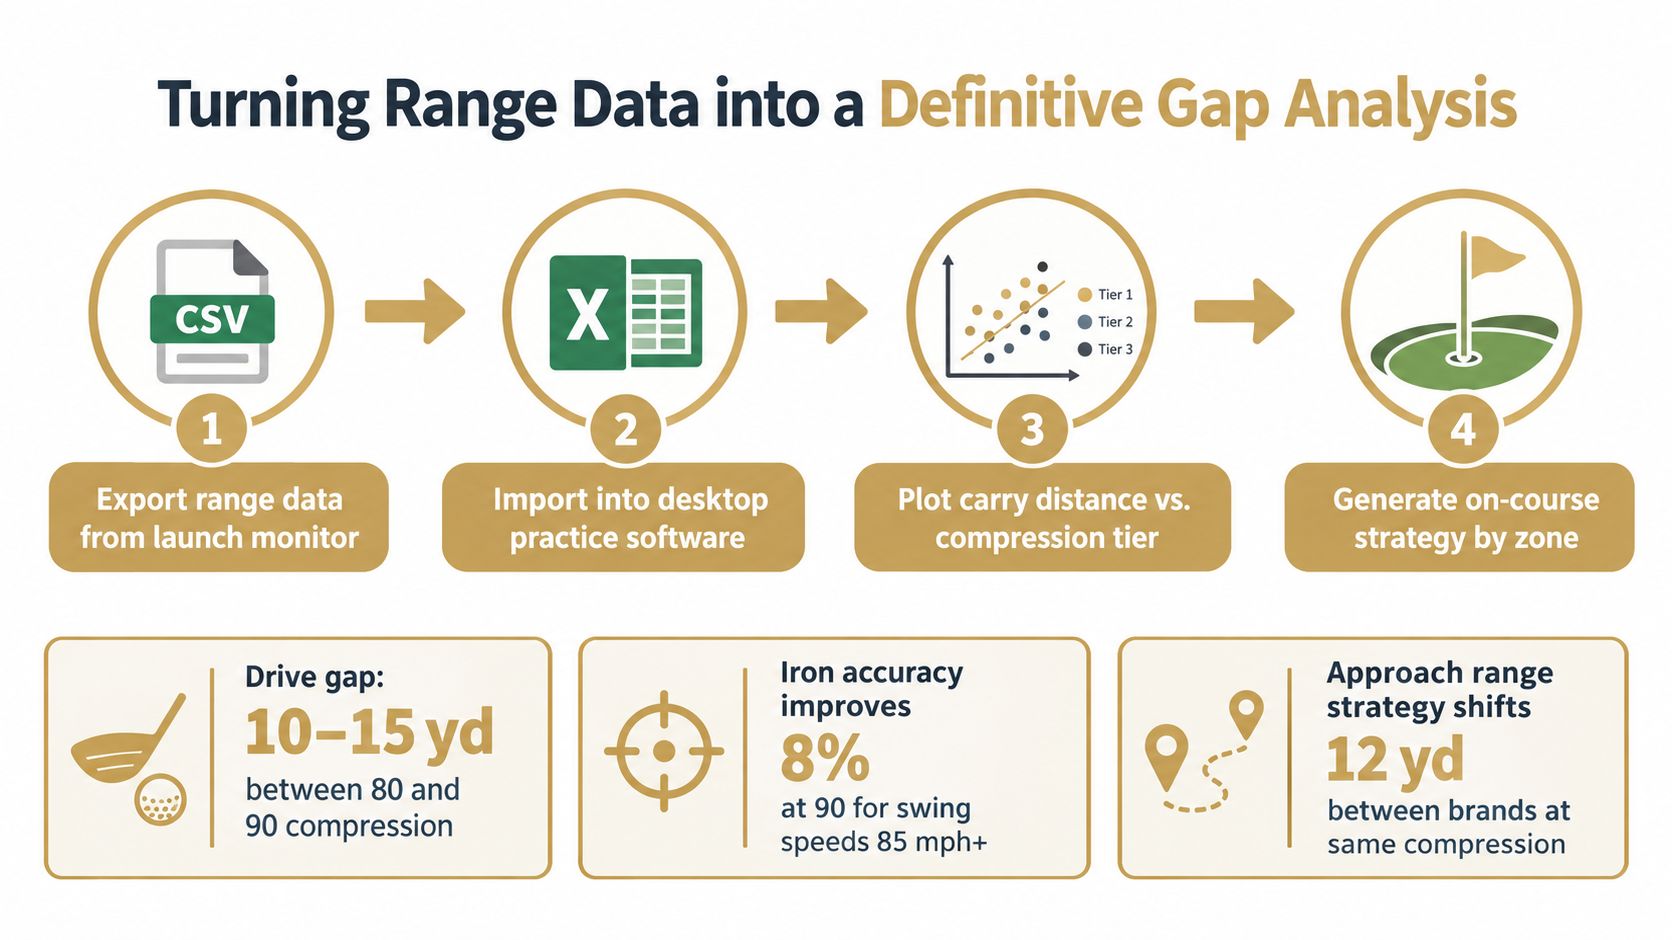
- Export range data from the launch monitor. Keep the session intact so the scatter and carry patterns stay visible.
- Import into desktop practice software. A spreadsheet or practice platform can help sort clean swings from noise.
- Plot carry distance against compression tier. That's where the overlap between balls usually shows up.
- Generate the on-course strategy by zone. The goal is a readable carry chart, not a pile of raw numbers.
The useful output is a printable gapping chart that shows where the 90-compression ball adds stability and where it doesn't. Once the golfer sees the pattern, the question stops being “what does 90 mean?” and becomes “which ball fits these clubs, this delivery, and these scoring shots?”
This gap analysis guide belongs right at the end of that workflow because it turns the range file into something the player can use on the first tee. That's the point of testing in the first place.
Dialed Golf gives golfers a way to connect launch-monitor practice, on-course caddying, and ball-fitting logic in one record. For players comparing 90 compression golf balls, that means using shot data, not marketing labels, to decide what fits. Visit Dialed Golf to see how the app, desktop tools, and fitting workflow can support a more controlled ball test.