

Picking the longest ball off a shelf sounds simple. A golfer reads a yardage, buys that ball, and expects longer drives. That shortcut rarely works, because a headline number hides the swing, strike, wind, and ground that created it. Distance is a result, not a label printed on a box.
Table of Contents
- Why the Longest Ball in Golf Is Harder to Pin Down
- Separating Ball Models, Records, and Test Conditions
- Record Benchmarks From Mike Austin to Kyle Berkshire
- Conditions That Add or Subtract Carry and Roll
- How Launch Angle, Spin, and Ball Speed Interact
- Reading Launch Monitor Data for Your Longest Drives
- Planning Your Baseline and Choosing a Next Step
Why the Longest Ball in Golf Is Harder to Pin Down
The popular advice says there's one longest ball in golf and every golfer should play it. That claim treats distance like a shoe size. It's closer to fuel economy. The same car returns different numbers in city traffic, on a motorway, and going downhill with a tailwind.
A ball doesn't travel by itself. A golfer delivers a club at a certain speed. The strike turns that speed into ball speed, launch angle, and spin. Then air, wind, and ground finish the job. Change any part and the total changes, even with the same ball in play.
Confusion starts because one phrase covers three different questions. One question asks which ball model flies farthest in a controlled test. Another asks who hit the farthest record drive. A third, more useful question asks which ball gives a specific golfer the longest shot that golfer can repeat and find.
A total yardage without carry, wind, ground, and format is only half a fact.
That distinction matters on the range. A launch monitor can show whether extra yards came from faster ball speed or from a lucky bounce on firm turf. It can also show whether those yards arrived with a wild spread. A headline can't do that work.
The honest answer is therefore personal. Records set useful outer limits. Standard tests show how balls behave under fixed conditions. A golfer's own repeated shots show what's real for that swing. Keeping those three ideas apart turns a confusing search into a clear fitting task.
Separating Ball Models, Records, and Test Conditions
Sorting a golf bag offers a useful picture. The ball in the pocket is equipment. A scorecard from a great round is a result. The weather that day is context. Nobody would claim the scorecard proves the ball caused the score. Distance claims need the same care.
Three Meanings That Get Mixed Together
A ball model is a product with a core, cover, and dimple pattern. Makers and governing bodies test it under set conditions so results can be compared fairly. That answers a narrow question. How does this ball behave when speed, launch, and spin are held steady?
A record is different. It's one shot by one person on one day. The format matters because the goal changes the setup, the risk, and sometimes the equipment. Three categories cover most famous numbers, and a comparison of those separate distance categories helps keep them from being ranked as if they were identical.
- Standard-course competition: A drive hit during a sanctioned event while playing a hole for score, with normal course setup and no second chances built into the format.
- Professional-tour measurement: A drive captured by tournament measurement systems during elite competition, where finding the fairway still matters.
- Specialized long-drive performance: A shot hit where maximum distance is the whole objective, with tee, equipment, and attempts arranged for that single purpose.
Why Test Conditions Are the Third Piece
Test conditions describe the world around the shot. Wind direction, elevation, temperature, fairway firmness, and landing slope all sit in this bucket. So do the launch numbers produced at impact. Two identical balls can finish far apart because one landed on a downslope and the other plugged in soft turf.
Think of a paper plane contest in a gym versus one on a windy hill. The outdoor winner may fly farthest, but that result says little about the best fold. Golf works the same way. Format and conditions must travel with the number, or the number misleads.
A practical rule follows from this sort. Before comparing any two yardages, a golfer should label each one. Was it carry or total? Was it a product test, a tournament shot, or a long-drive attempt? What helped it along? Once those labels are in place, comparisons become fair and records become interesting instead of confusing.
Record Benchmarks From Mike Austin to Kyle Berkshire
History gives distance a human face. Three well known drives show why category comes before ranking. Each number is real in its own setting. None of them means quite the same thing as the others.
The Competition Benchmark on a Standard Course
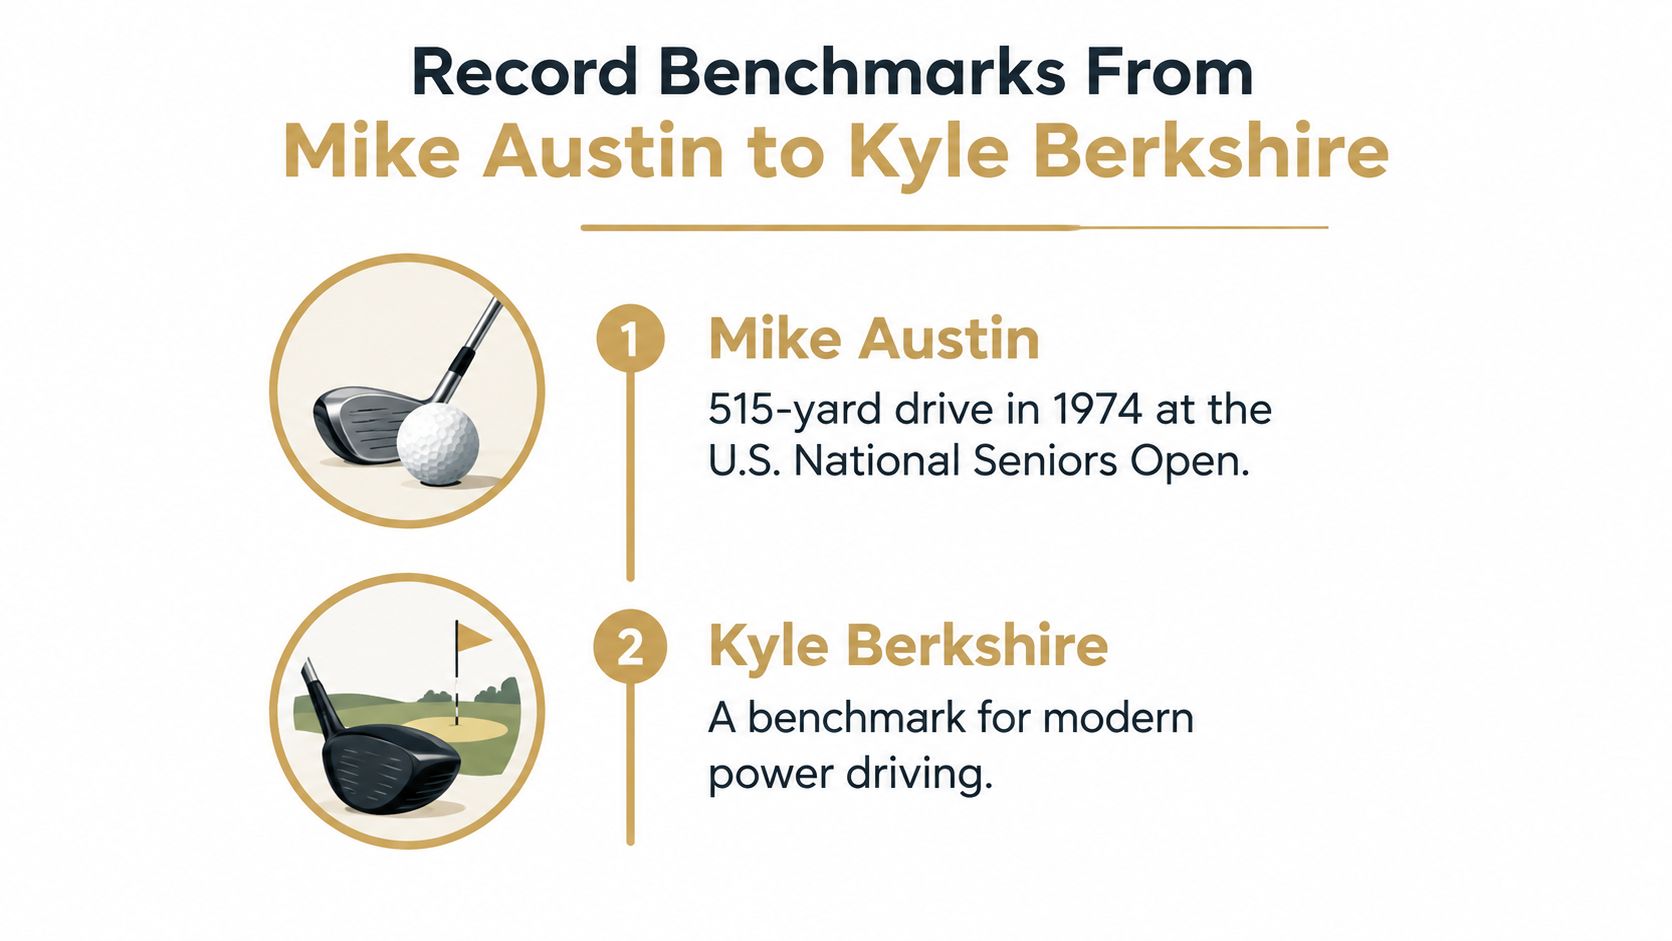
The starting point is Mike Austin's 515-yard drive on September 25, 1974, at the U.S. National Seniors Open Championship in Las Vegas, aided by a tailwind of approximately 27 mph. Austin was 64 years old. He used a conventional persimmon wood driver with a steel shaft, equipment far removed from modern titanium heads and current balls.
The hole tells much of the story. The par-4 fifth at Winterwood Golf Course, now Desert Rose, placed the green about 450 yards from the tee. Austin's ball carried beyond that green, bounced, and rolled roughly 65 yards past the flagstick. The measured total came to 515 yards, or 471 meters.
Two details keep that number honest. First, it happened during sanctioned tournament play on a standard course, not in a distance exhibition. Second, the strong tailwind and rollout did real work. Great strike met generous conditions. Both facts belong in the record.
Tour Measurement and Long-Drive Performance
Professional tour measurement tells a tighter story. Tiger Woods hit a 498-yard drive on the par-5 18th at Kapalua during the 2002 Tournament of Champions, commonly identified as the longest PGA Tour drive recorded through ShotLink in the verified account. That's about 17 yards short of Austin's mark, roughly 3.3% less, despite far newer equipment. Layout, wind, and ground explain why simple equipment timelines don't settle the comparison.
Specialized long drive sits at the other end. Kyle Berkshire was reported to have driven a ball 579.66 yards in October 2023 at Rochelle Ranch in Wyoming. That's about 12.6% beyond Austin's competition mark. Berkshire wasn't playing a hole for score. The setting, equipment choices, and objective all served one goal, maximum total distance.
Placed side by side, the three figures form a scale, not a single contest. Austin marks standard-course competition. Woods marks elite tour measurement. Berkshire marks purpose-built long drive. A golfer reading any future headline can now ask better questions. Which category produced the shot? How much was carry? How much help did the day provide?
Conditions That Add or Subtract Carry and Roll
Distance has two parts that golfers often blend into one. Carry is how far the ball flies before first touching the ground. Total distance adds bounce and roll after landing. A shot can look long on total while carrying an ordinary number, and the difference matters over bunkers, water, and doglegs.
One Record Drive Split Into Its Parts
Berkshire's 2023 long-drive mark shows the split clearly. The shot measured 579.66 yards in total at Rawlins Golf Club, carried about 515 yards, stayed airborne for roughly 11 seconds, and then rolled about 64.7 yards. That carry figure alone matches Austin's entire total from a different era and format.
The roll portion carries the lesson. Nearly a full short pitch shot of that total happened after landing. Firm ground and a shallow landing let the ball keep moving. Soft turf or an upslope would've cut that bonus sharply. Ranking the shot by total alone hides where the yards came from.
Conditions Worth Recording Every Session
Wind is the most obvious helper or hurdle. A tailwind pushes and can stretch both carry and roll, while a headwind lifts and stalls many shots. Elevation and temperature change air density, so the same flight travels differently in thin mountain air and in cold, heavy air at sea level.
Ground completes the picture. Firm fairways reward a lower landing. Wet fairways grab the ball. Landing angle decides much of that outcome, since a steep descent drops and stops while a shallow descent skips forward. Setup feeds into those numbers too, which is why a correct driver stance for repeatable launch belongs in any distance test.
- Wind speed and direction: Note whether it helped, hurt, or crossed.
- Elevation and temperature: Record both when comparing venues.
- Ground firmness: Mark the landing area as soft, normal, or firm.
- Carry and total kept apart: Never store only the bigger number.
Session habit: A favorable day isn't a new personal standard until the same carry shows up on a plain day.
That checklist protects a golfer from false progress. It also protects against false alarm when a cold, calm morning steals yards. Conditions don't excuse a shot. They explain it.
How Launch Angle, Spin, and Ball Speed Interact
Physics sounds forbidding until it's built one layer at a time. Start with speed. Add direction. Then add spin. Each layer changes what the previous one can deliver, which is why chasing a single perfect number usually fails.
Ball Speed Does the Heavy Lifting
Ball speed is the strongest independent factor in distance. It's the energy that leaves the clubface and becomes flight. Clubhead speed matters, but strike quality decides how much of it survives impact. A centered strike at moderate speed can outfly a faster swing that catches the toe or heel.
A simple picture helps. Ball speed is the engine. Launch angle is the ramp. Spin is the wing. A strong engine aimed at the wrong ramp wastes power. A fine ramp with a weak engine goes nowhere. Distance needs the whole machine, and a driver ball speed chart for framing personal numbers gives that engine useful context.
Launch and Spin Form a Window, Not a Target
Governing-body testing provides a reference window for high-speed play. The USGA and R&A identify roughly 7.5 to 15 degrees of launch angle and 2,200 to 3,000 rpm of backspin as representative bounds for optimized testing, using clubhead speed of at least 125 mph. Those bounds describe the longest-driving population under study. They aren't a prescription for every swing.
Spin creates lift through the Magnus effect, which keeps the ball in the air longer. The same spin also adds drag, which pulls distance back. Too little spin and the ball can't stay up, so it falls early. Too much spin and the ball climbs, stalls, and drops short with a steep landing.
How Key Launch Variables Affect Distance
| Variable | Reference Range or Principle | Effect on Distance |
|---|---|---|
| Ball speed | Higher is stronger, strike quality permitting | Drives carry more than any single factor |
| Launch angle | About 7.5 to 15 degrees in high-speed testing | Too low cuts carry, too high wastes energy upward |
| Backspin | About 2,200 to 3,000 rpm in high-speed testing | Adds lift and drag, so balance beats extremes |
| Descent angle | Shallower favors roll, steeper favors stopping | Shapes how much total follows the carry |
The fitting method is plain. Change one variable at a time, whether that's tee height, loft, strike location, or ball model. Keep the change only if carry and total improve without wrecking dispersion. The longest ball in golf for a given swing is the one that keeps speed, launch, and spin inside that working window most often.
Reading Launch Monitor Data for Your Longest Drives
A launch monitor session can overwhelm a golfer with columns. The trick is reading a small group of numbers together and ignoring the urge to crown the single longest shot. One swing is an anecdote. A cluster of swings is evidence.
Faster Doesn't Always Mean Longer
One robot result makes that point with unusual clarity. Golf Digest's 2025 robot test found a 95-mph swing producing 250.5 yards while a 105-mph swing produced 245 yards, because the faster swing created inferior launch conditions. Speed went up. Distance went down. Launch decided the argument.
That finding reframes practice. A golfer who swings harder and launches the ball poorly may lose yards while feeling more powerful. The monitor catches that trade. Ball speed, launch angle, spin rate, carry, apex, descent angle, and dispersion belong on the same screen, in the same glance. Reading them together is central to choosing the best launch monitor setup for driving range work and to using any device well.
A Simple Way to Compare Sessions
- Group by club and ball: Never mix driver shots with fairway wood shots or test balls with gamer balls in one average.
- Sort by carry first: Carry reflects flight quality, while total can flatter a shot that landed on a downslope.
- Check the spread: A ball that adds a few yards but doubles the miss pattern costs strokes.
- Match the conditions: Compare sessions only when wind, temperature, and ground were broadly similar.
- Keep the session file: Saved data turns memory into a trend that can be checked weeks later.
Dispersion deserves special respect. A drive that carries long into rough, trees, or a penalty area isn't usable distance. Smart fitting weights the center of the shot pattern, not the heroic outlier at its edge. The repeatable maximum, the longest cluster a golfer can produce on demand, is the number worth building a bag around.
The shot to trust is the one that shows up five times, not the one that shows up once and gets a screenshot.
Over time, saved sessions answer questions a single range visit can't. Did a new ball raise carry or only roll? Did a tee height change hold up after a week? Trends settle those debates calmly.
Planning Your Baseline and Choosing a Next Step
The longest ball for you is not automatically the ball that leads a distance test. A test sets a useful reference point, while your own repeatable numbers show what works with your swing. The upcoming rule change makes that distinction easier to see.
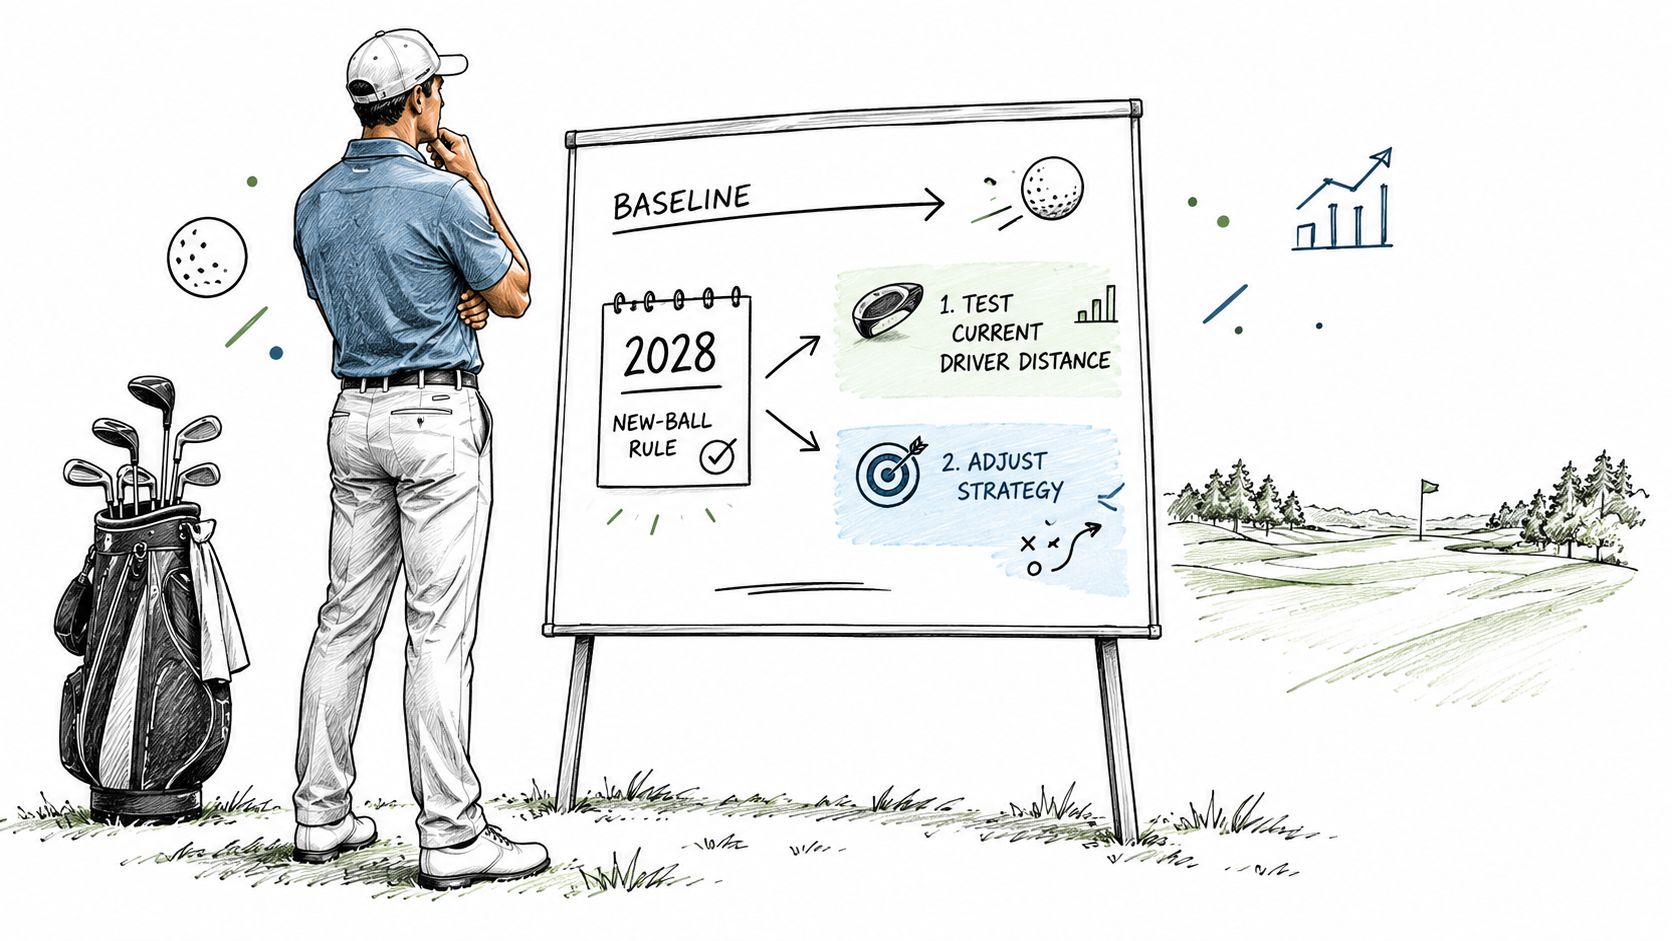
The current Overall Distance Standard permits 317 yards with a 3-yard tolerance at 120-mph clubhead speed, 10-degree launch, and 2,520 rpm, while the 2028 testing cycle shifts to 125 mph, 11 degrees, and 2,220 rpm. The yardage limit remains 317 yards, but the test conditions move toward the speed and launch of the longest hitters.
That change does not predict an equal distance loss for every amateur. Ball speed and launch conditions depend on the golfer's swing, so a result from an elite-speed test is not a direct forecast for someone swinging slower. Treat the test as a ruler, not a personal fitting result. Your baseline gives you the useful comparison.
Build that baseline in one focused session. Use the same club and ball for repeated drives, and record wind and ground conditions alongside carry, total distance, spin, and dispersion. Those details are the labels on the jar: without them, a later comparison can mix unlike shots. Keep the session file, then compare other balls against it rather than relying on memory, advertising, or a single standout drive.
Dialed Golf supports this process with a launch-monitor practice product that imports data from several monitors and saves it for review. A saved record helps keep carry, roll, and dispersion together when you compare sessions.
The next step is simple: schedule a baseline session, save the results, and note the conditions. Use that personal record to judge each distance claim. The longest ball is the one that gives you useful, repeatable distance with a shot pattern you can play.
A golfer ready to replace guesswork with a labeled baseline can start with the free web tools, then build a saved launch-monitor history that separates carry, roll, and dispersion for every ball tested. Visit Dialed Golf to set up that record and judge the next distance claim against real personal numbers.