

A golfer has narrowed the choice to a soft-feeling ball and a firmer alternative, but the compression numbers don't quite agree across reviews. Buying a golf ball compression tester seems like the obvious way to settle the question. The catch is that a number without a testing method can create more confusion than clarity.
The useful question isn't just which ball reads lower. It's whether the difference survives repeated measurements, and whether either ball produces better shots for that golfer.
Table of Contents
- What a Compression Tester Measures
- Compression Rating Bands at a Glance
- How to Run a Repeatable Compression Test
- Why Two Testers Give Different Numbers
- What Compression Does and Doesn't Tell You About Performance
- Home Tester, Lab or Skip Before You Buy
What a Compression Tester Measures
A golf ball compression tester measures how much a ball deforms under a controlled force. The operator places the ball between two contact surfaces, called anvils, applies pressure, and measures how far the ball flattens. That change in shape is its deflection. The tester is a measurement system: its reading depends on how the instrument applies and records the test.
The basic arrangement is easier to see in a mechanical sketch.
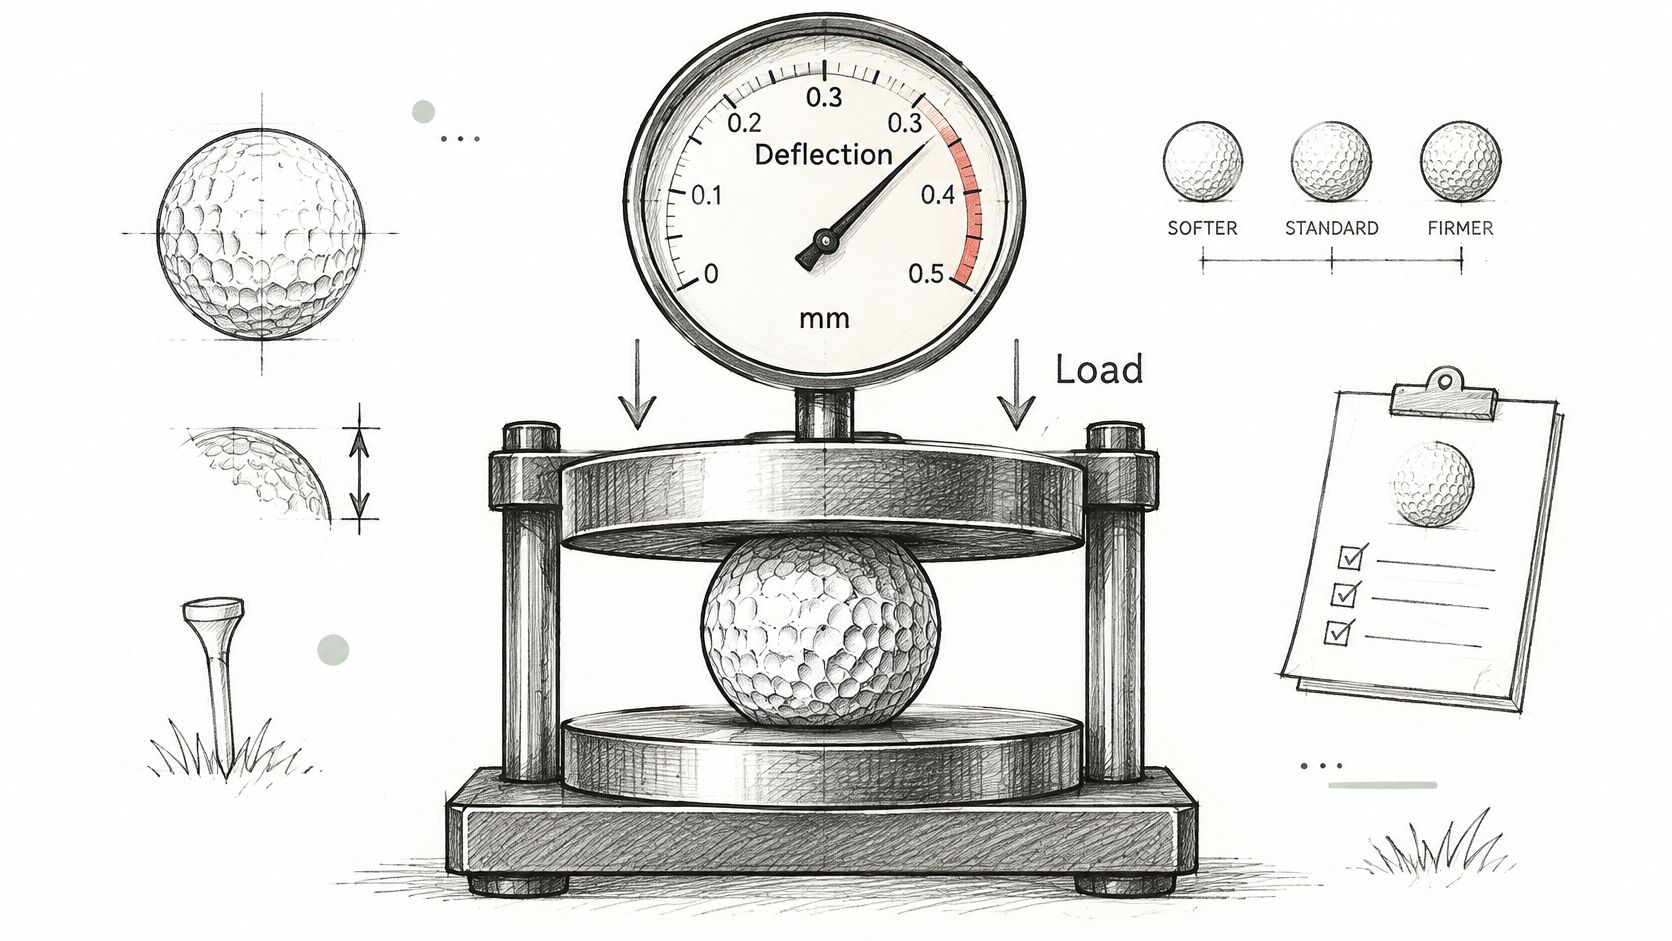
A tester can calculate a spring rate by dividing the change in force by the change in displacement over its measurement window. It then converts that stiffness measurement into a compression rating. So the displayed number is the output of a calculation based on the ball's measured response, rather than a direct measure of how far the ball will travel.
Why the scale needs context
The U.S. compression-tester patent document traces compression ratings to the 1940s, when manufacturers needed a way to assess inconsistent ball hardness. It describes the traditional convention in which 100 is harder than 90, and a handheld device with a display ranging from 80 at its softest end to 160 at its hardest end.
That history helps explain why a familiar rating is not a universal physical unit. Older compression conventions were associated with wound-ball construction, including how tightly rubber thread surrounded the core. As solid-core balls replaced those constructions, testing equipment needed to relate the newer designs to the familiar scale.
For an unfamiliar ball, the tester records its response to a particular load, through particular anvils, then applies its own conversion method. A different instrument may convert that response differently, much like two rulers with different starting points can assign different numbers to the same length.
Practical rule: A compression rating belongs to a measurement system and procedure. Before comparing balls, establish which tester produced each result.
A higher number means a firmer reading only within a compatible measurement system. It describes the ball's response in that test, not its distance potential or fit for a particular swing.
Compression Rating Bands at a Glance
A reading of 94 falls in the 90 to 99 band, but the band is only useful when the tester's scale is compatible with the one used for comparison. Treat these as conventional lookup bands that help organize results, rather than as guarantees about ball flight or official specifications.
Compression rating bands and what they usually mean
| Rating range | Conventional label | Deformation under test | Common reason to try it |
|---|---|---|---|
| Under 70 | Very soft | Largest flattening | Exploring maximum feel and a softer short-game response |
| 70 to 79 | Soft | Large flattening | Trying a softer impact sensation without starting at the softest end |
| 80 to 89 | Soft to mid | Moderately large flattening | Comparing softer feel with a more substantial strike |
| 90 to 99 | Mid | Moderate flattening | Establishing a reference for comparing feel and flight |
| 100 to 109 | Mid-firm | Small flattening | Testing whether a firmer construction suits a search for driver spin and launch control |
| 110 and above | Firm | Least flattening | Considering a firmer feel when launch is controlled and short-game results are reliable |
The final column describes testing intentions, not outcomes a rating can promise. A softer band alone cannot establish how chips will respond, since the cover and the ball's actual short-game performance matter. Likewise, moving to a firmer band does not by itself show that driver spin will fall.
The historical handheld scale described earlier does not reach the lowest bands in this table. A label such as “under 70” therefore may not be available on every instrument.
A worked example without false precision
Three fresh balls from the same model read 91, 94, and 97 on one tester. Their average is 94, in the 90 to 99 band, and their spread is 6 points.
The lowest reading alone would make the model look softer than the highest reading alone. Neither represents the sample fairly. The average gives a useful summary, but it does not show how much the individual results vary.
- Find the band: Use the average to organize a trial, not to declare a winner.
- Check the spread: Compare each model's range of readings before comparing its average with another model's.
- Investigate overlap: If the results overlap substantially, gather more evidence before concluding that one model is firmer.
A result of 89 rather than 90 does not establish a meaningful change just because it crosses a table boundary. A boundary sorts readings into labels; it does not show whether the difference is larger than the variation in the measurements.
Use the band as a starting hypothesis. Repeated measurements, consistent conditions, and a clear record of the tested balls make the comparison more defensible.
How to Run a Repeatable Compression Test
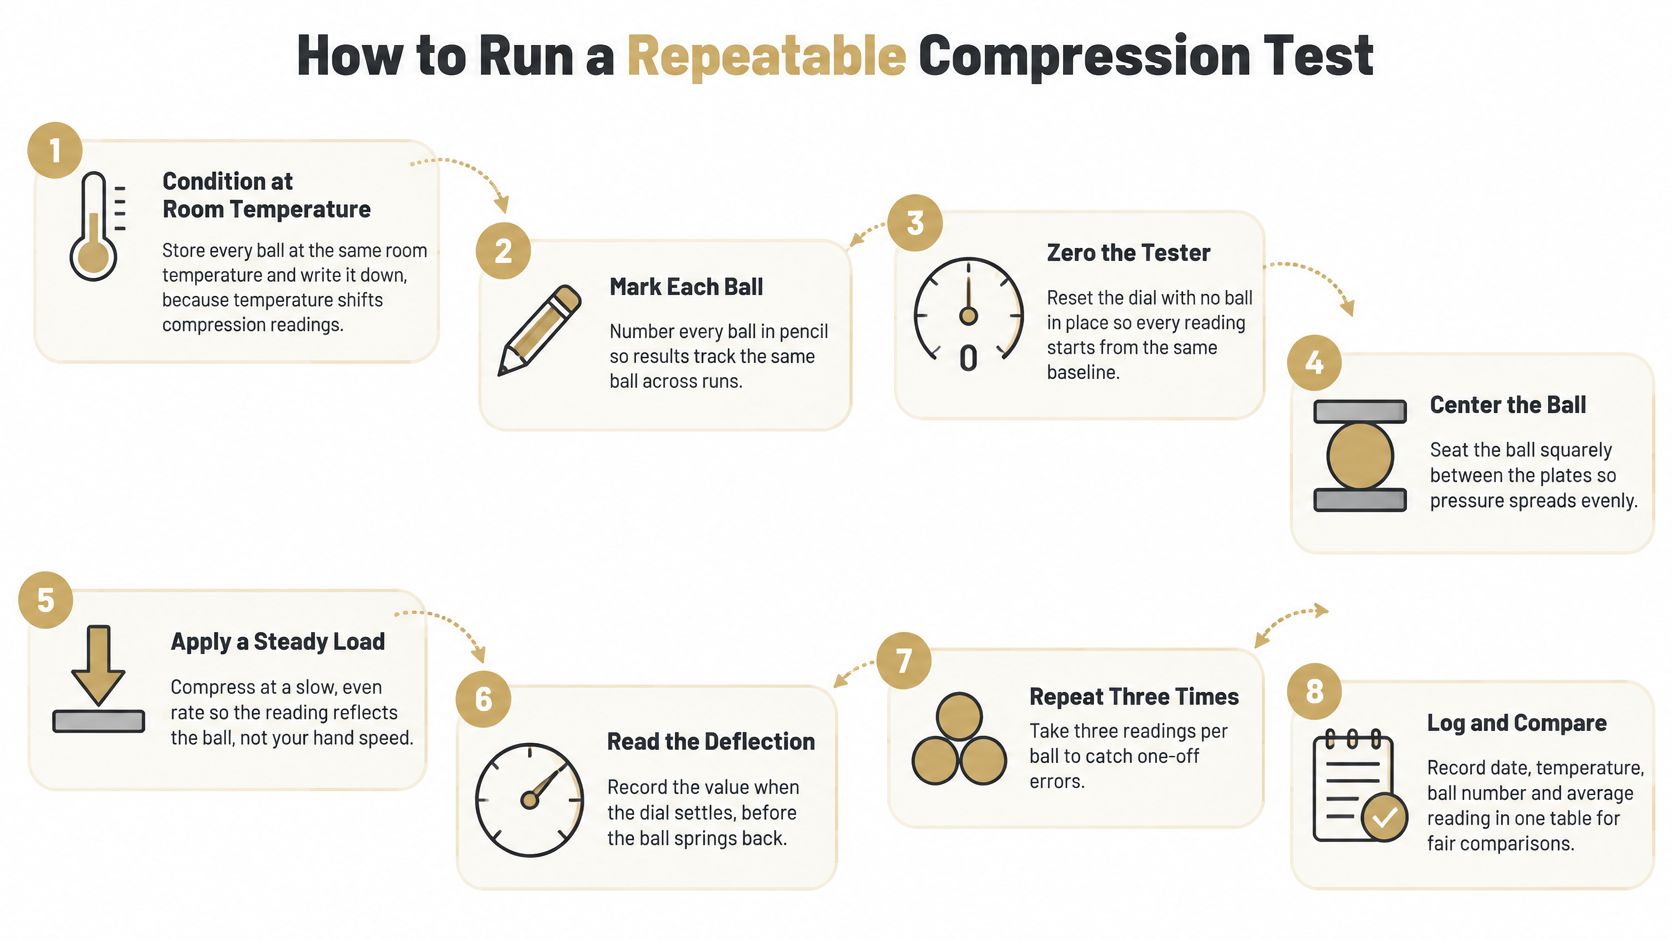
Condition every ball at the same temperature. Store the samples together until they reach a stable room temperature, then record it. Moving balls directly from a cold car into a warm testing room makes the comparison harder to interpret.
Inspect and identify each sample. Set aside balls with cuts, pronounced scuffs, or prior impact marks, and assign each accepted ball an identifier. That identifier connects later readings to the same physical sample rather than just the model name.
Verify the tester before loading. Zero the displacement system, check calibration according to the instrument's procedure, and inspect the anvils for debris or damage. A shifted baseline can affect the entire batch.
Center the ball consistently. Seat it squarely between the anvils and record its orientation. Consistent placement helps separate ball behavior from changes in contact position.
Precondition only with suitable equipment. The laboratory-style protocol described by Today's Golfer uses approximately 200 lbf of preconditioning, followed by two 100 lbf loading cycles separated by 15 seconds, reports the second cycle, and recommends comparing 10 to 18 balls per model. Preconditioning reduces first-loading distortion associated with hysteresis and the Mullins effect.
Run the prescribed loading sequence. Apply the initial measurement cycle, release the load, observe the specified interval, and perform the reporting cycle. Keep loading rate and dwell time consistent rather than squeezing faster when a reading seems unexpected.
Save the reporting cycle and its context. Record the final rating alongside raw force and deformation data when available, plus temperature, ball age, orientation, and instrument settings. Keeping only a rounded compression number discards information needed to investigate an odd result.
Repeat across the sample, then summarize. Calculate the model's average and note its spread, while retaining individual readings. An unusually high or low result should trigger inspection and a controlled retest, not automatic deletion.
The visual checklist helps organize sample handling, identification, and recordkeeping.
Match the procedure to the instrument
The infographic's repeated-read workflow is a general checklist, not a replacement for the laboratory loading sequence. An operator should follow a validated method supported by the tester rather than combine incompatible instructions or attempt loads beyond its rating.
Within a fixed method, greater deformation produces a lower, softer reading, while smaller deformation produces a higher, firmer reading. A home device may not reproduce a laboratory force profile, so consistency matters more than trying to make its display match a published result.
For fitting work, the launch-monitor app workflow provides useful context for organizing the separate hitting session. Compression records and shot records should share sample identifiers without treating them as the same measurement.
The accompanying video offers another view of the testing process.
A clean result is a stable cluster of readings and a log that another operator could reproduce. A tidy average without that record isn't enough.
Why Two Testers Give Different Numbers
A ball tested on two devices can receive different ratings even when neither reading is faulty. Compression is the output of a measurement system: the device applies a load, measures a response, and converts that response to a displayed number. Different systems may use different devices, loading windows, and calculations, so their numbers are not automatically comparable.
Golf Digest's explanation of compression testing describes how companies use devices that measure different characteristics. Contact geometry matters too. Flat anvils can catch on dimples, while purpose-designed depressions can reduce contact-related uncertainty.
What moves a compression reading and where to control it
| Variable | Why it moves the reading | Where to control it |
|---|---|---|
| Anvil profile | Flat anvils can catch on dimples and add force noise unrelated to stiffness | Check the anvil design in the tester specification and inspect the contact surfaces |
| Load range | Different force windows sample different portions of the deflection curve | Use the same prescribed measurement cycle across sessions |
| Conversion curve | Each system maps measured stiffness onto its own rating scale | Compare ratings across testers only after validating their relationship |
Anvil shape changes how pressure reaches the ball. Careful centering cannot remove a systematic difference caused by different contact geometry. Calibration and zeroing can also shift a tester's readings as a group, while conversion curves can translate similar physical responses into different displayed ratings. Temperature, age, and visible damage create additional differences between samples that calibration cannot remove.
What a documented comparison looks like
In 2025, Today's Golfer's independent test worked with Loughborough University, consulted The R&A, and measured 62 models with 18 balls per model, producing 1,116 compression trials on an Instron 3365. The scale of the test still depended on a documented procedure to make its results interpretable.
A personal tester is useful when the operator separates within-system repeatability from agreement between systems. Repeatability asks whether the same setup gives similar results under the same conditions. Agreement asks whether separate testers report comparable numbers, which requires checking how their methods and scales relate.
Noise check: A hypothetical five-point gap between isolated readings may reflect the measurement process rather than a dependable difference between models.
To judge a gap, first measure the same identified balls again in separate sessions and note the spread of those readings. Then compare different balls within each model. Treat a difference as persuasive only when it exceeds the observed spread across sessions and persists across samples. If the gap falls within that spread, the tester has not shown that the models differ reliably.
What Compression Does and Doesn't Tell You About Performance
Compression doesn't choose the ball. A static squeeze measures one response under controlled loading, while a club strikes the ball at speed. Treating the rating as a complete fitting answer is like weighing a car and claiming to know its handling.
The Master of the Greens compression guide describes the relationship between compression and speed-dependent ball behavior as gradual rather than a sharp swing-speed cutoff. Construction, cover, mantle, and temperature also affect the result. A softer tester reading can therefore coexist with quite different driver spin, iron launch, or wedge behavior.
Feel needs its own evaluation, too. The tester can provide a firmness reference, but it can't reproduce the sound, vibration, and cover interaction a golfer experiences with different clubs.
Turn the rating into a performance trial
A useful hitting session holds the club, target, monitor setup, and environmental conditions as steady as practical. The operator alternates models rather than finishing one entire batch before starting the next, reducing the chance that fatigue or a changing swing dominates the comparison.
The session record should include:
- Ball speed: Assess the response to comparable strikes rather than celebrating the fastest isolated shot.
- Launch angle: Check whether the ball produces a usable trajectory with each relevant club.
- Spin rate: Separate driver needs from approach-shot and wedge requirements.
- Carry: Compare repeatable distances, not just the longest attempt.
- Dispersion: Examine the spread of outcomes as well as their average.
A driver ball-speed chart can help frame the speed discussion, but it shouldn't become a compression prescription. Strike quality and the combined launch conditions still determine whether a particular model works.
Warm, cold, before, or after
Test balls at their expected playing temperature. Room-temperature testing is useful for controlled comparisons, but a golfer investigating cold-weather performance needs samples conditioned for that situation, not balls that warm up beside the hitting mat.
Record compression before the launch-monitor session to establish a baseline. After a heavy session, re-measure a small identified sample only when wear or repeated impacts are suspected of changing the ball, and restore the original testing conditions before comparing results.
A measured carry difference belongs to the hitting trial. It isn't a compression result, even when the firmer ball also happens to carry farther. Compression helps organize a controlled investigation; the golfer's flight, consistency, and short-game requirements determine the choice.
Home Tester, Lab or Skip Before You Buy
Home tester versus independent lab testing
| Factor | Home or personal tester | Independent lab test |
|---|---|---|
| Upfront cost | Device purchase; Rimac Golf's 2025 listing priced its tester at $1,495 and specified a 19 lb unit | Commissioned testing requires a quote; published results need no equipment purchase |
| Weight and portability | A dedicated device, with the listed example better suited to a testing station than a golf bag | Equipment stays at the testing facility |
| Repeatability | Depends on the operator's protocol and calibration controls | A documented protocol can control test conditions |
| Sample size | Limited by available time and ball supply | A defined multi-ball sample across the published model selection |
| Speed of answer | Immediate once samples and equipment are ready | Commissioned work is scheduled; published results are already available |
| Best for | Coaches and fitters running repeat trials | Brands, publishers, and anyone needing a documented baseline |
A personal tester makes sense when it will be used regularly and the measurement process can be kept consistent. For a golfer choosing a playing ball, buying a tester may answer only part of the question: it measures compression, but does not complete a fitting.
An independent laboratory can provide controlled measurements and documentation. Published results may still differ from the exact model generation, ball condition, or temperature being investigated. Before commissioning a test, specify the question and request the method, sample handling, raw outputs, and reporting format.
Match the purchase to the decision
- For a personal ball choice: Skip the tester initially. Compare two or three models using at least ten fresh balls from each, kept at the same temperature. Use comparable strikes and a consistent monitor setup.
- For weekly client fitting: Borrow or buy a tester if repeated firmness comparisons will shape the workflow. Keep raw readings and calibration notes from the first session.
- For a documented baseline: Use a laboratory or a published test with methods and samples that fit the question.
- For coaching: Use compression to organize trials, then judge the ball by carry, spin, and dispersion rather than applying a fixed speed-to-compression rule.
For an outdoor trial, the driving-range launch-monitor guide can help you plan around setup constraints. A stable monitor setup and consistent hitting conditions make the comparison easier to interpret.
A range-session task worth doing
Before changing equipment, select three ball models and hit ten recorded shots with each, then compare carry and spin spread. Treat those counts as a practical starting exercise, not as a laboratory standard or proof of statistical certainty.
Keep mishits in the record and note the strike, rather than removing disappointing outcomes. If one exceptional shot determines the apparent winner, repeat the comparison in another session before buying.
Record the ball model, tester reading, ball condition and temperature, plus the test procedure. Compare results only after those controls match; a difference that disappears when the procedure is repeated may reflect measurement variation rather than a useful distinction.
Dialed Golf offers a course-side consumer app, desktop launch-monitor practice, and Dialed Academy for ranges and clubs. Desktop practice supports live pairing with Garmin R10 and imports from Garmin, Rapsodo, SkyTrak, FlightScope, Uneekor, GSPro, Awesome Golf, and more; Golfer Pro covers app and desktop at $9.99/week, $29.99/month, $149.99/6 months, or $249.99/year. Explore the desktop practice tools at Dialed Golf.