


What if the carry number that looks like progress is only a different launch monitor reading the same swing? A golfer who mixes devices, ball types and mishits into one average can't tell improvement from instrumentation, and a total score can't answer the question either. A well-built golf stats tracker Excel spreadsheet solves that problem inside the workbook itself. It keeps device provenance, sample-size gates and shot categories beside every number, so one lucky shot doesn't become a new benchmark. The build below uses two record types, five tabs and a small set of formulas that stay useful week after week.
Table of Contents
- Columns Your Golf Stats Tracker Needs
- How to Build the Workbook in Five Tabs
- How to Import Launch Monitor CSV Files Cleanly
- Formulas for Averages, Gaps and Strokes Gained
- Pivot Tables and Charts for Gapping and Trends
- Run Your First Import and Check the Numbers
Columns Your Golf Stats Tracker Needs
Shot rows and round rows answer different questions, so they do not share a table. A practice row is one swing. A round row is one score. Blend them and every average has to guess what the row means.
Each column has to change a practice choice or a club choice. If it does not, it is clutter. Device source, Category, and a sample-size gate belong on the shot row itself, next to the distances, so a monitor change or one flushed strike cannot pass as a better swing.
Fields to Record and the Decision Each One Supports
| Field | Example entry | Decision it supports |
|---|---|---|
| Session date and session ID | 2026-08-10, S-014 | Groups results by session and tracks change over time |
| Device source | Garmin R10, Rapsodo | Keeps monitors separate so a device change is not read as improvement |
| Club and ball type | 7 Iron, premium ball | Separates gapping from an equipment change |
| Lie | Fairway | Stops a tee strike and a tight lie from sharing one stock number |
| Carry and total distance (yards) | 152 carry, 158 total | Core inputs for gapping windows |
| Ball speed, spin rate, launch angle | 112 mph ball speed, launch recorded per shot | Explains why carry moved when the club did not |
| Club speed | 84 mph | Shows whether swing speed or strike quality changed |
| Start direction | 4 yards left | Shows a start pattern that distance alone hides |
| Start lie, end lie, start distance, end distance | Fairway to green, 152 yards to 18 yards | Gives strokes gained a start point and an end point |
| Valid | Yes or No | Keeps mishits and failed reads out of averages |
| Category | Driving, approach, short game, putting | Splits shots so strokes gained is not one blended number |
| SG | Approach value for that shot | Stores the strokes-gained result on the row that produced it |
| Quality flag | Hold or Usable | Blocks a club average until the same club, ball, and device have more than a single clean shot |
| Round score, fairways hit, greens in regulation, putts | 82, 8 fairways, 9 greens, 31 putts | Connects practice to on-course scoring |
Carry by club sets the gapping window. A loft change moves that window, which is the point of the hybrid golf club lofts chart guide. Do not average carry across two values in Device source. Store both sessions. Compare them only after each device has its own usable sample.
Start direction shows a miss pattern a yardage hides. Valid drops a topped shot or a bad read. Quality flag stays on Hold when that club and device have only one clean shot. One shot is noise. I would not move a stock yardage, or call a session a personal best, while the flag still says Hold.
A column earns its place only if removing it would change a practice or club selection decision.
Paste these header rows into row one, in this order. Later sheets reference these names exactly.
Shots: Session ID | Date | Device source | Club | Ball type | Lie | Carry | Total distance | Ball speed | Spin rate | Launch angle | Club speed | Start direction | Start lie | End lie | Start distance | End distance | Valid | Category | SG | Quality flag
Rounds: Round ID | Date | Score | Fairway | Greens in regulation | Putts
How to Build the Workbook in Five Tabs
Five tabs keep raw data, reference lists and results apart, which means a bad paste never rewrites history. Raw Import holds untouched CSV pastes. Lookup holds the club list and expected-strokes baseline. Shots holds cleaned shot rows, Rounds holds one row per round, and Dashboard holds pivots and charts.
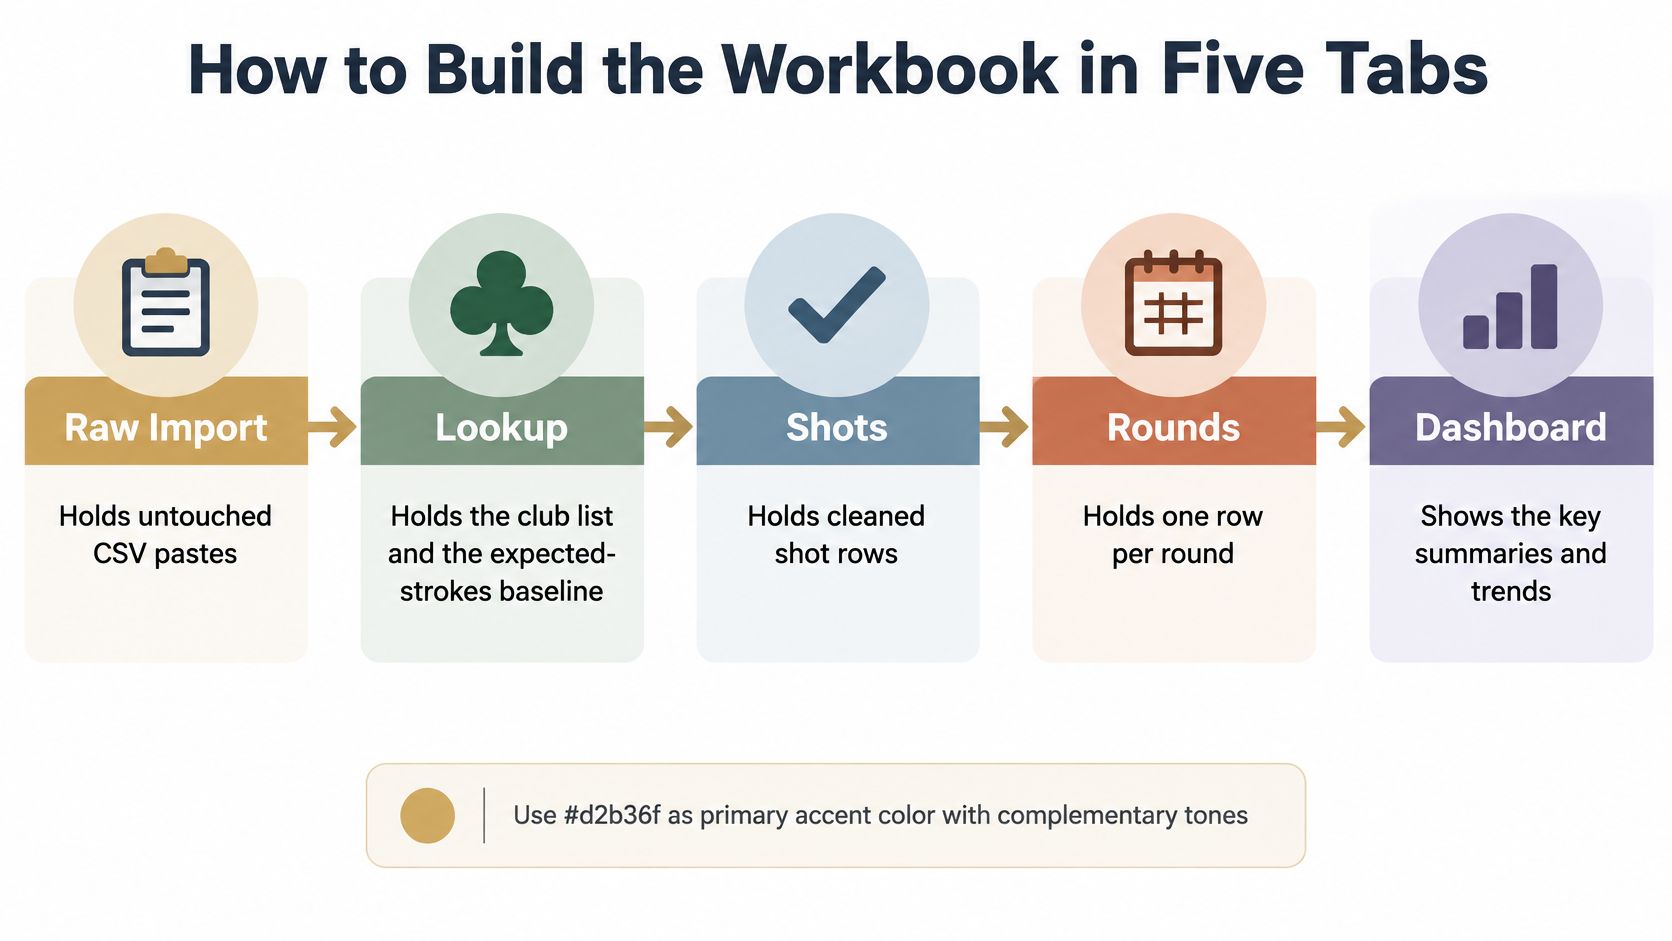
Numbered Build Steps
- Create the five tabs and rename them exactly as above. Consistent tab names let formulas and PivotTable sources stay readable months later.
- Paste each export into Raw Import and never edit it there. If a mapping fails, the original paste allows a clean re-import instead of forensic repair.
- Convert Shots and Rounds to Excel Tables with Ctrl+T. Table formulas and references extend automatically to new rows, while plain ranges stop at the last row typed during setup.
- Build the club and lie lists on Lookup, then attach dropdown data validation to Club, Lie, Shot category, Ball type and Valid. The common slip is typing 7i in one row and 7 Iron in another, which splits one club into two groups and halves both samples.
- Add Session ID and date columns formatted as real dates rather than text. Text dates sort wrong and break rolling ranges.
- Freeze the header row on every data sheet. A golfer scrolling through hundreds of shots shouldn't have to guess which column holds spin.
- Point Dashboard formulas at Table names rather than cell addresses. Shots[Carry] grows with the table, while $F$2:$F$200 excludes shot 201.
A Quick Test Before Real Data
Enter one dummy shot in Shots, refresh the Dashboard and confirm the totals move. Then delete the dummy row and confirm the totals return. That two-minute check catches a broken Table reference before a full range session depends on it.
The separation matters most when something goes wrong. A misaligned CSV column corrupts Raw Import only. A wrong club spelling shows up in Lookup validation. The Dashboard stays a reporting surface, never a place where source records get edited by hand.
How to Import Launch Monitor CSV Files Cleanly
One best shot isn't a trend, and one clean paste isn't a clean import. Device exports use different headers, units and column orders, so importing is a mapping job, not a copy and hope exercise. Treating every export as identical is how a monitor change gets celebrated as a swing change.
Six Import Steps
- Export the session as CSV from the device or software and paste it into Raw Import without trimming columns.
- Map each export header to the standard Shots columns for carry, total distance, ball speed, spin rate, launch angle and club speed, and write that mapping on the Lookup sheet. A written mapping survives a month away from the workbook.
- Stamp Device source and Session ID on every imported row before any calculation runs. Provenance added later relies on memory.
- Set Valid to No for mishits, obvious tracking failures and range balls mixed into a premium-ball sample.
- Add data validation range checks that reject impossible values, such as negative carry or club speed far outside the golfer's normal range.
- Resolve every Quality flag before the row reaches the Dashboard. An unresolved flag means the row stays out of averages.
What Reliability Allows, and What It Doesn't
The Journal of Strength and Conditioning Research launch-monitor reliability study found reliable within- and between-session measures for clubhead speed, ball speed, carry distance and total distance, with coefficients of variation no higher than 5.8% and intraclass correlations of at least 0.87 in the tested golfers. Those metrics can carry a benchmark once the sample is large enough. Launch angle was less uniformly stable, so it stays labelled provisional until a repeat session confirms it.
Cross-device blending is the bigger trap. A 2025 peer-reviewed comparison of three launch monitors found carry-distance correlations of only r = 0.61 to 0.66, while mean spin-rate bias ranged from 73.67 to 641.90 rpm. Don't average carry or spin across monitors. Keep a separate baseline for each device source, and treat any change of device as a reset in the trend line rather than as improvement.
Setup discipline protects the gate. Warm up the same way, keep monitor placement and target alignment fixed, and hit a predefined number of shots per club. Show a club average only after its valid count reaches the chosen minimum. Below that count, the Dashboard displays provisional, which is honest and prevents a single flushed shot from rewriting the bag.
Formulas for Averages, Gaps and Strokes Gained
Every formula reads the Shots and Rounds tables, and the Valid flag belongs in every shot-level criteria. An average that includes mishits describes the range session, not the shot the golfer will trust on the course.
Strokes Gained, Built From Expected Strokes
The Journal of the Royal Statistical Society strokes-gained analysis describes each shot as expected strokes from the starting state minus expected strokes from the ending state minus one stroke taken. The Lookup sheet therefore holds an expected-strokes baseline by distance and lie, and the SG column pulls from it with XLOOKUP. Record starting lie, starting distance, ending lie, ending distance and shot outcome for each shot.
Aggregate results into driving, approach, around the green and putting. Then add a check cell confirming the category totals equal the round's total strokes gained. That additive check catches broken lookups before they reach a chart, because a category sum that can't reconcile to the round result signals a fault in the data or the baseline. Context on how speed relates to output sits in the driver ball speed chart breakdown.
Core Formulas for the Golf Stats Tracker
| Metric | Excel formula | What it shows |
|---|---|---|
| Average carry by club | =AVERAGEIFS(Shots[Carry],Shots[Club],"7 Iron",Shots[Valid],"Yes") | Centre of your carry window for that club |
| Carry spread by club | =MAXIFS(Shots[Carry],Shots[Club],"7 Iron",Shots[Valid],"Yes")-MINIFS(Shots[Carry],Shots[Club],"7 Iron",Shots[Valid],"Yes") | Width of the window; a wide spread means inconsistent contact |
| Valid shots per club | =COUNTIFS(Shots[Club],"7 Iron",Shots[Valid],"Yes") | Sample gate before any benchmark is displayed |
| Fairways hit percentage | =COUNTIF(Rounds[Fairway],"Yes")/COUNTA(Rounds[Fairway]) | Driving accuracy by round |
| Rolling 5-round score average | =AVERAGE(INDEX(Rounds[Score],ROWS(Rounds[Score])-4):INDEX(Rounds[Score],ROWS(Rounds[Score]))) | Smooths out single bad rounds |
| Strokes gained by category | =SUMIFS(Shots[SG],Shots[Category],"Putting") | Shows which part of the game moved |
Sample warning: average carry from three valid shots is an anecdote wearing a formula. Hold benchmarks back until the count gate passes.
Average carry gives the centre of the window, while carry spread shows whether that centre means anything. A narrow spread supports aggressive club selection. A wide spread says contact varies too much for the average to be trusted at a forced carry.
The rolling 5-round average protects against overreacting to one bad Saturday. Strokes gained by category then explains the movement, pointing practice at the part of the game that changed instead of the part that felt worst. That's the diagnostic edge raw putt totals can't offer, because a shot finishing close after a poor approach and a shot finishing close after a good one look identical in a putt count.
Pivot Tables and Charts for Gapping and Trends
The gapping chart earns the most opens, so build it first and build it from a PivotTable rather than hand-summarised cells. Pivots refresh when new sessions land, which keeps the chart honest without manual rework.
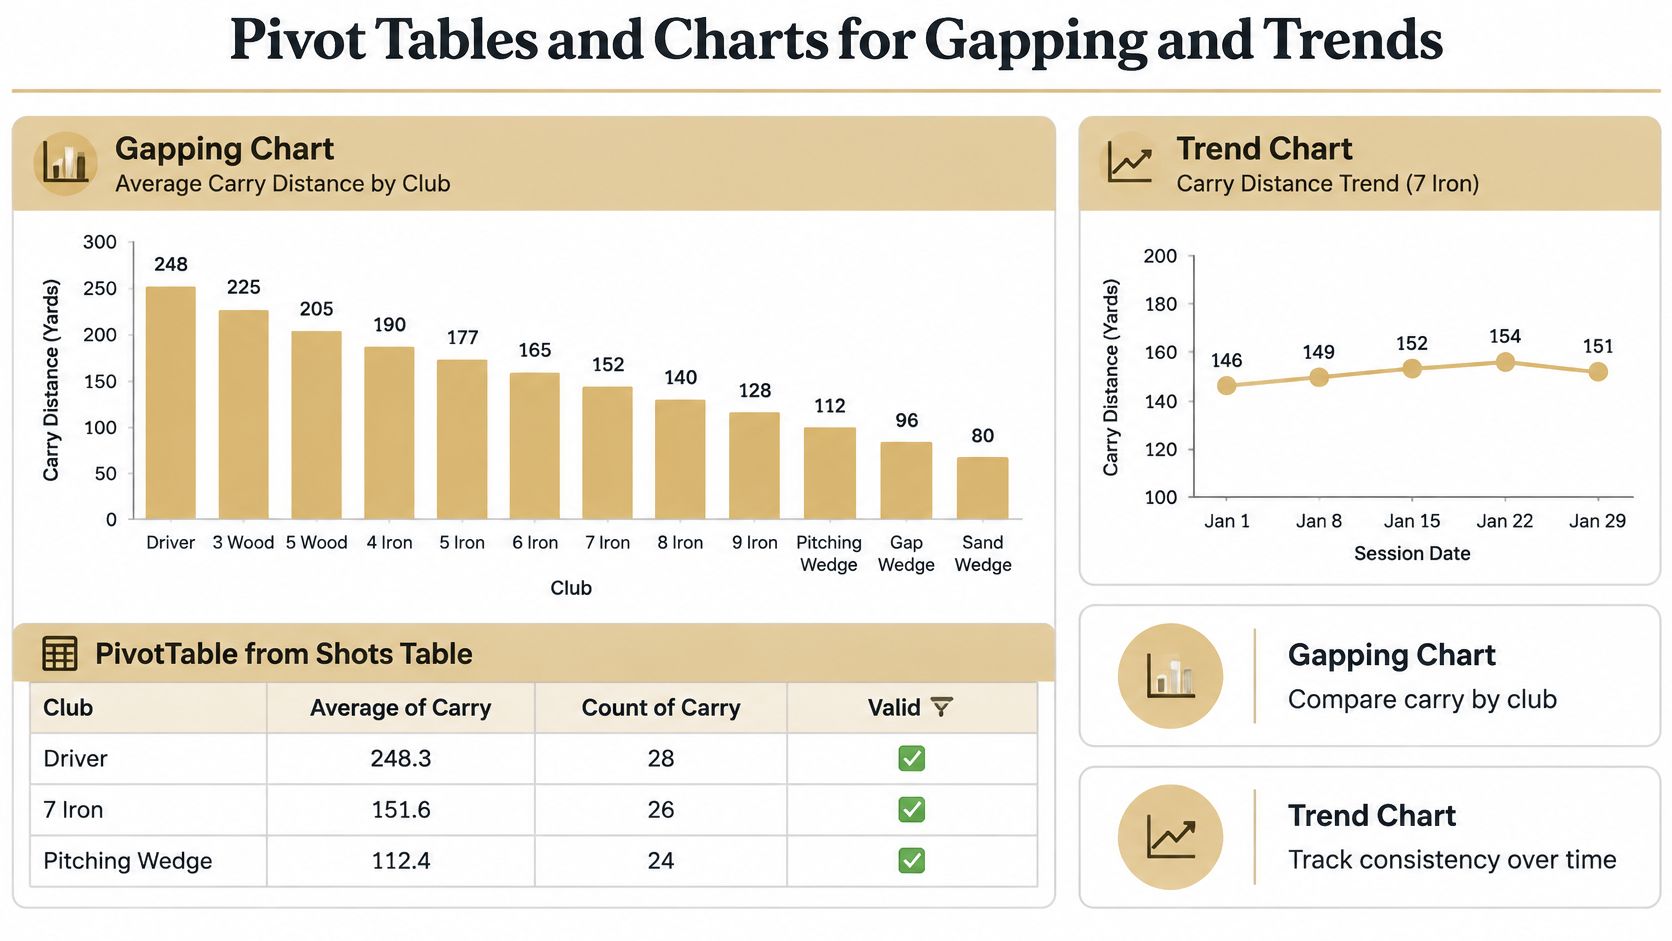
Building the Gapping View
- Insert a PivotTable from the Shots table, with Club in rows, Average of Carry and Count of Carry in values, and Valid filtered to Yes.
- Sort clubs by average carry, longest first, so the bag reads in playing order.
- Build a column chart of average carry and add carry spread as error bars or a second series.
- Read the gaps between neighbouring clubs. A gap larger than the spread of the clubs around it is a real hole. Overlapping windows mean the bag doubles up, a pattern a structured gap analysis walkthrough helps interpret.
- Add a line chart of the rolling 5-round score average, plus per-session carry for one reference club, with a Device slicer so monitors never blend into one line.
- Place the benchmark table beside the charts so rolling values sit next to amateur reference points.
Amateur Reference Values for Your Dashboard
The Sport Journal study of NCAA Division I male golfers reported that the average player hit approximately 68% of fairways and reached greens in regulation about 60% of the time, needed 1.88 putts per green reached in regulation, and took slightly more than 31 putts per round.
| Benchmark | Amateur reference | Use it to |
|---|---|---|
| Fairways hit | About 68% | Compare driving accuracy with your rolling average |
| Greens in regulation | About 60% | Set the first target for approach play |
| Putts per green reached in regulation | 1.88 | Track how well approaches convert into putting |
| Putts per round | Just over 31 | Watch the total putting trend across sessions |
Use these as a first target, not a pass mark. They come from amateur golfers, and a personal baseline built over rolling 5, 10 or 20 rounds matters more than any external reference. A golfer trending from well below a benchmark toward it is improving, whatever the gap.
One chart habit prevents self-deception. Start the vertical axis at zero so differences look as large as they really are. A truncated axis can turn a two-yard carry drift into an apparent breakthrough, and the whole workbook exists to stop that kind of misreading.
Run Your First Import and Check the Numbers
Start with one range session, not a folder of them. A file small enough to read by hand shows a bad header or a blank device cell before those errors sit inside a month of shots. Check the gates, read one chart, and write one practice target.
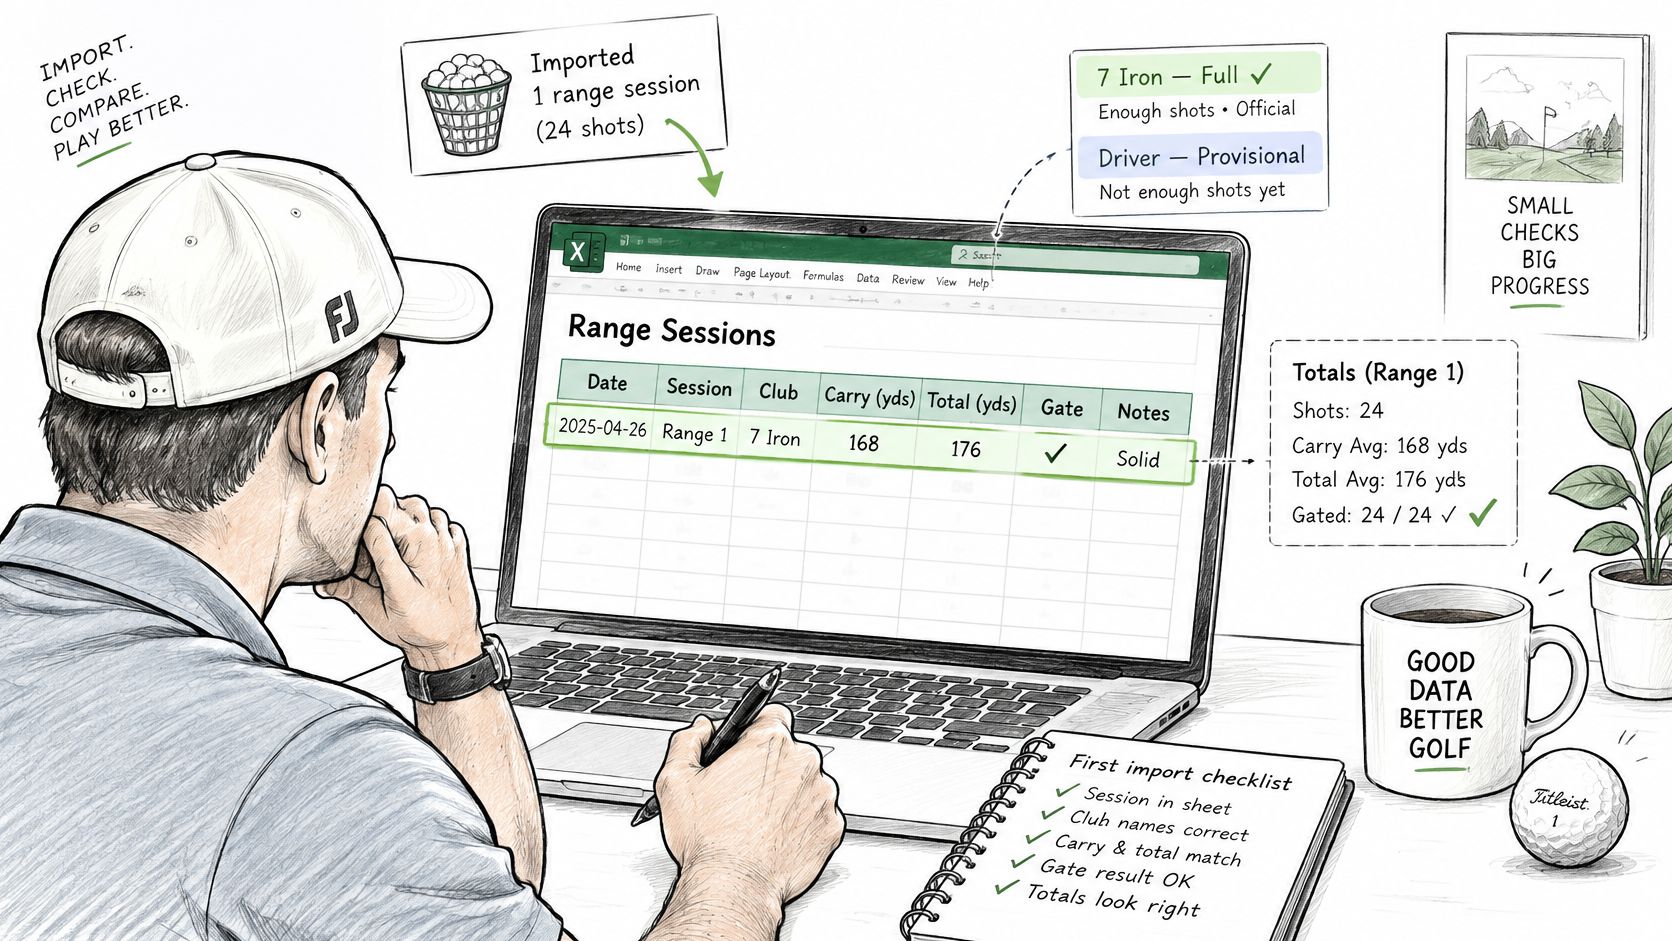
The First Session, Step by Step
Import a session with at least as many valid shots as the gate requires for the clubs being judged. Each club should show a full or provisional label that matches its count. Category strokes gained should add up to the round total. Then pick one gap or overlap for the next visit. One target is what makes that next session measurable.
- Headers match: column names in Shots and Rounds match the header rows exactly.
- Valid flags are set: mishits and failed reads show No, with no blanks.
- Device source is filled in: every imported row carries its monitor name.
- One chart has been read: the gapping chart or trend line has a written interpretation.
- One practice target is written down: a single gap, overlap or pattern problem owns the next session.
Cross-checks Beyond the Workbook
The Golf Bag Gap Analyzer spots overlaps and missing yardages in the bag. The Carry Distance Chart Generator builds a printable reference for the clubs you trust. Both stay free and need no account. Treat them as a second pass on the same yardages, not as a replacement for the sheet's device column and sample-size gate.
Running that same export through Dialed Golf beside the workbook catches a column mapped on one side and missed on the other.
When a new monitor arrives, paste its session under its own device name and leave the earlier rows frozen. Compare only clubs that cleared the gate on both units. A carry shift of a similar size on every club is a device offset. A shift on one club, with the others stable and both samples past the gate, is the change worth practicing. A short cluster on the new unit is not a personal best against a full gated mean on the old one.
Build the workbook, run the first gated import, then compare the same session in Dialed Golf. Desktop practice on macOS and Windows, the TestFlight pocket caddy (not App Store general availability), and free web tools feed one golfer record. Golfer Pro is $9.99 per week, $29.99 per month, $149.99 per six months, or $249.99 per year. Live pair starts with Garmin R10 and expands, with imports from Garmin, Rapsodo, FlightScope, SkyTrak, Uneekor, GSPro, and Awesome Golf, among others. Ranges and clubs can look at Dialed Academy at $99.99 per month or $999.99 per year, with the club keeping its dues.