


The search usually starts the same way. A golfer finishes a range session, checks a 7-iron number, and realizes the chart on the screen doesn't match the one in their head. The club didn't suddenly change. The golfer's profile, the measurement method, and the conditions did.
That's why typical distance for golf clubs is a useful phrase only if it's treated as a range, not a promise. A single yardage number hides the core question, which is how far a club travels for a golfer with a specific swing speed, strike pattern, and data source. The best reference point is a carry window, then a gap check, then a reality check against the course.
Table of Contents
- Introduction to Typical Distance for Golf Clubs
- How to Read Distance Charts Without Misleading Yourself
- Typical Distances by Club From Driver Through Lob Wedge
- Carry Versus Total and Simulator Versus On Course
- Why the Same Club Varies So Much by Swing Speed and Skill
- Build Your Personal Carry Windows From Launch Monitor Data
- Gap Analysis and Practice Priorities for Your Bag
- Quick Reference Carry Chart and Re Test Plan
Introduction to Typical Distance for Golf Clubs
A golfer usually looks up club distance at a decision point. The ball is in hand, the yardage is known, and the question is whether the number on a chart fits the player, the strike, and the day.
That is where typical distance for golf clubs gets misread. A club does not have one universal yardage. Distance shifts with swing speed, contact quality, launch conditions, and whether the number is carry or total.
The evidence points to wide separation between golfer profiles. A 2019 USGA report put the average male amateur driver at 217 yards, while the PGA Tour average driving distance that year was 293.9 yards, a 76.9-yard gap that shows how far distance moves with speed and skill (GolfLink's summary of the USGA benchmark).
The right mental model
Start with the golfer, then the club, then the measurement method. A short hitter, a mid hitter, and a long hitter can all use the same iron and live in different distance bands.
Practical rule: if a chart does not say who it is for, how it was measured, and whether it reports carry or total, it is not ready for club selection.
The useful unit is a carry window, not a single headline number. That window should be checked against swing-speed band, launch setup, and the source of the data. A range session, a simulator, and on-course tracking can produce different answers from the same club, so the goal is to build a personal window and use that for gapping decisions.
How to Read Distance Charts Without Misleading Yourself
A distance chart only helps if the golfer knows what it measures and who it is built for. A club does not have one fixed yardage. The number changes with swing speed, contact quality, launch conditions, and whether the chart reflects a golfer profile that resembles yours.
Start with the chart's labels
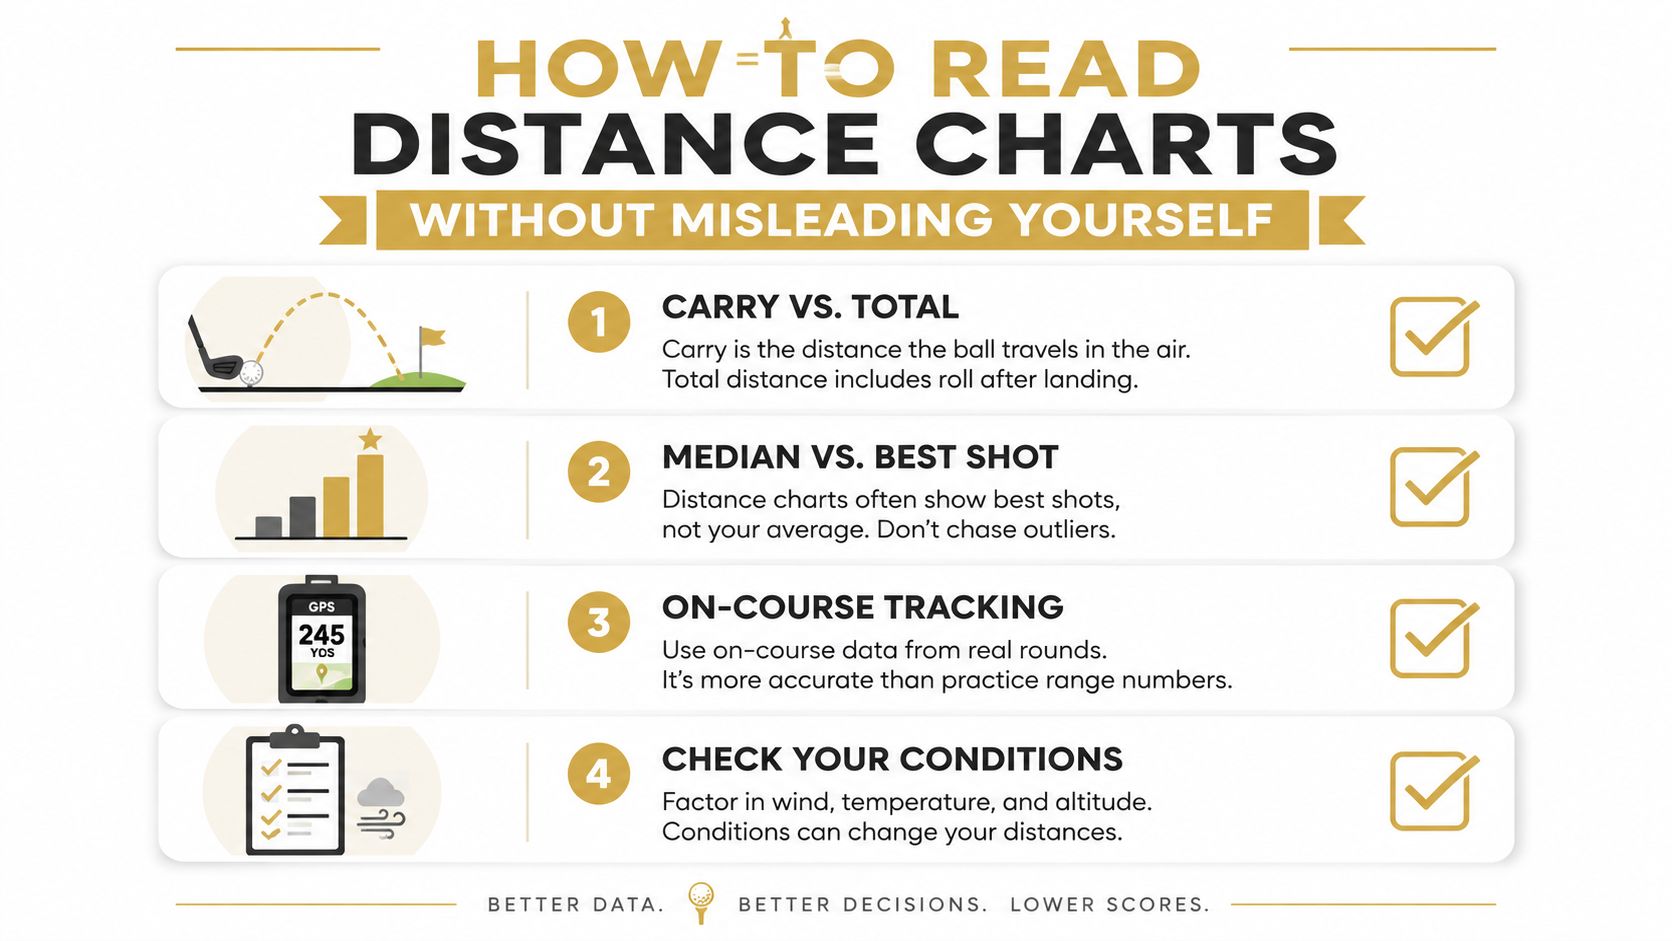
Read the metric first. If the chart does not say whether it uses carry or total, it is incomplete for club selection. If it does not say whether the number comes from typical shots, simulator sessions, or on-course tracking, treat the figure as a rough reference rather than a decision rule.
The next check is sample quality. A chart built from best strikes will usually sit longer than one built from central results. That difference matters because golfers do not choose clubs from their best swing of the day. They choose from the swing they can repeat under pressure.
Judge the golfer profile before the yardage
The more useful question is not how far a club goes in the abstract. It is how far that club goes for a golfer with similar speed, strike pattern, and consistency. A short hitter, a mid hitter, and a long hitter can all use the same iron and produce different windows.
That makes single-number charts risky. They hide spread, and spread is what decides whether a gap is playable.
Compare only like with like
A simulator figure and an on-course number can disagree without either one being wrong. Turf firmness, wind, landing angle, altitude, and device modeling all affect the result. The answer is to compare the same club, measured the same way, in the same setting.
A chart is useful only when the golfer knows who the chart represents, what it measured, and how the sample was collected.
That is the standard for reading distance tables without getting misled. A chart should lead to a personal carry window and a gap check, not a generic number copied into a bag decision.
As noted in a discussion of chart ambiguity, many distance references blur carry and total, or mix skill-based clusters with true averages, which makes the headline number less useful than the method behind it (PlayBetter's discussion of chart ambiguity).
Typical Distances by Club From Driver Through Lob Wedge
A club chart is most useful when it starts with the golfer, not the club. The same iron can produce a narrow window for one player and a broad overlap for another, so the question is how the bag gaps behave from top to bottom. The table below should be read as carry windows, and the windows are only meaningful when the golfer profile behind them is clear.
Typical Carry Distance Windows by Club and Player Segment
| Club | Male Amateur Window | Female Amateur Window | Elite / Tour Reference |
|---|---|---|---|
| Driver | about 200 to 230 yards for male amateurs, with a commonly cited amateur benchmark of 217 yards (GolfBit's aggregated distance chart) | about 150 to 200 yards depending on ability band (GolfBit's aggregated distance chart) | about 275 to 293.9 yards for PGA Tour references (GolfBit's aggregated distance chart) |
| 3-Wood | about 180 to 225 yards in common amateur bands (GolfBit's aggregated distance chart) | about 125 to 180 yards (GolfBit's aggregated distance chart) | higher than amateur bands, but varies by player segment |
| 5-Wood | usually below driver and above long iron territory, with distances that sit inside the upper fairway-wood band | below the 3-wood band, above hybrids | elite references sit well above amateur windows |
| 7-Wood / 3-Hybrid | often sits in the bridging zone that replaces long irons for many golfers | usually a stable gap club in the middle of the bag | tour players still separate cleanly from amateur windows |
| 4-Iron to 6-Iron | the gap narrows, and consistency matters more than raw length | distance compresses faster than many golfers expect | tour-level 7-iron reference sits much higher than amateur 7-irons |
| 7-Iron | about 140 to 160 yards is a practical mid-bag window for many male amateurs (GolfBit's aggregated distance chart) | typically below the male-amateur window, with wide variation by segment | about 197 yards for PGA Tour references, or 145 yards in another male-amateur comparison chart |
| 8-Iron to 9-Iron | should step down in a controlled, readable pattern | the same logic applies, but the windows are shorter | elite reference still remains well above amateur bands |
| Pitching Wedge | often lives in the scoring-transition zone rather than the “full swing” ego zone | shorter than the male-amateur window, but still a reliable stock club | tour references sit materially higher |
| Gap Wedge, Sand Wedge, Lob Wedge | distance becomes less about power and more about controlled spacing | many golfers see the steepest compression here | elite references still preserve separation, though wedges are closer together |
The mid-bag usually matters more than the driver. A practical male-amateur 7-iron often lives around 140 to 160 yards, while one compiled reference places PGA Tour 7-iron distance near 197 yards and male amateur 7-iron distance near 145 yards. That gap is enough to make a set look ordinary on paper and still play unevenly in the bag. Once the center of the set is off, every club above and below it starts to look less predictable.
How to use the windows
Do not compare every club to the same absolute standard. Driver, fairways, and long irons can show wider spacing because speed drives more of the result. Wedges compress because control drives more of the result. The useful test is simple, each club needs a distinct job and a clear handoff to the next club.
Carry windows work best when they're read as ladders. If the next club does not clearly start where the previous one ends, the bag is asking the golfer to guess under pressure.
A single average-distance chart hides that structure. One summary can say a club is typical, while the golfer still needs to know whether that club functions as a gap, a forced-carry option, or a scoring club. The chart is a reference point, but the bag decision comes from how those windows stack against one another.
Carry Versus Total and Simulator Versus On Course
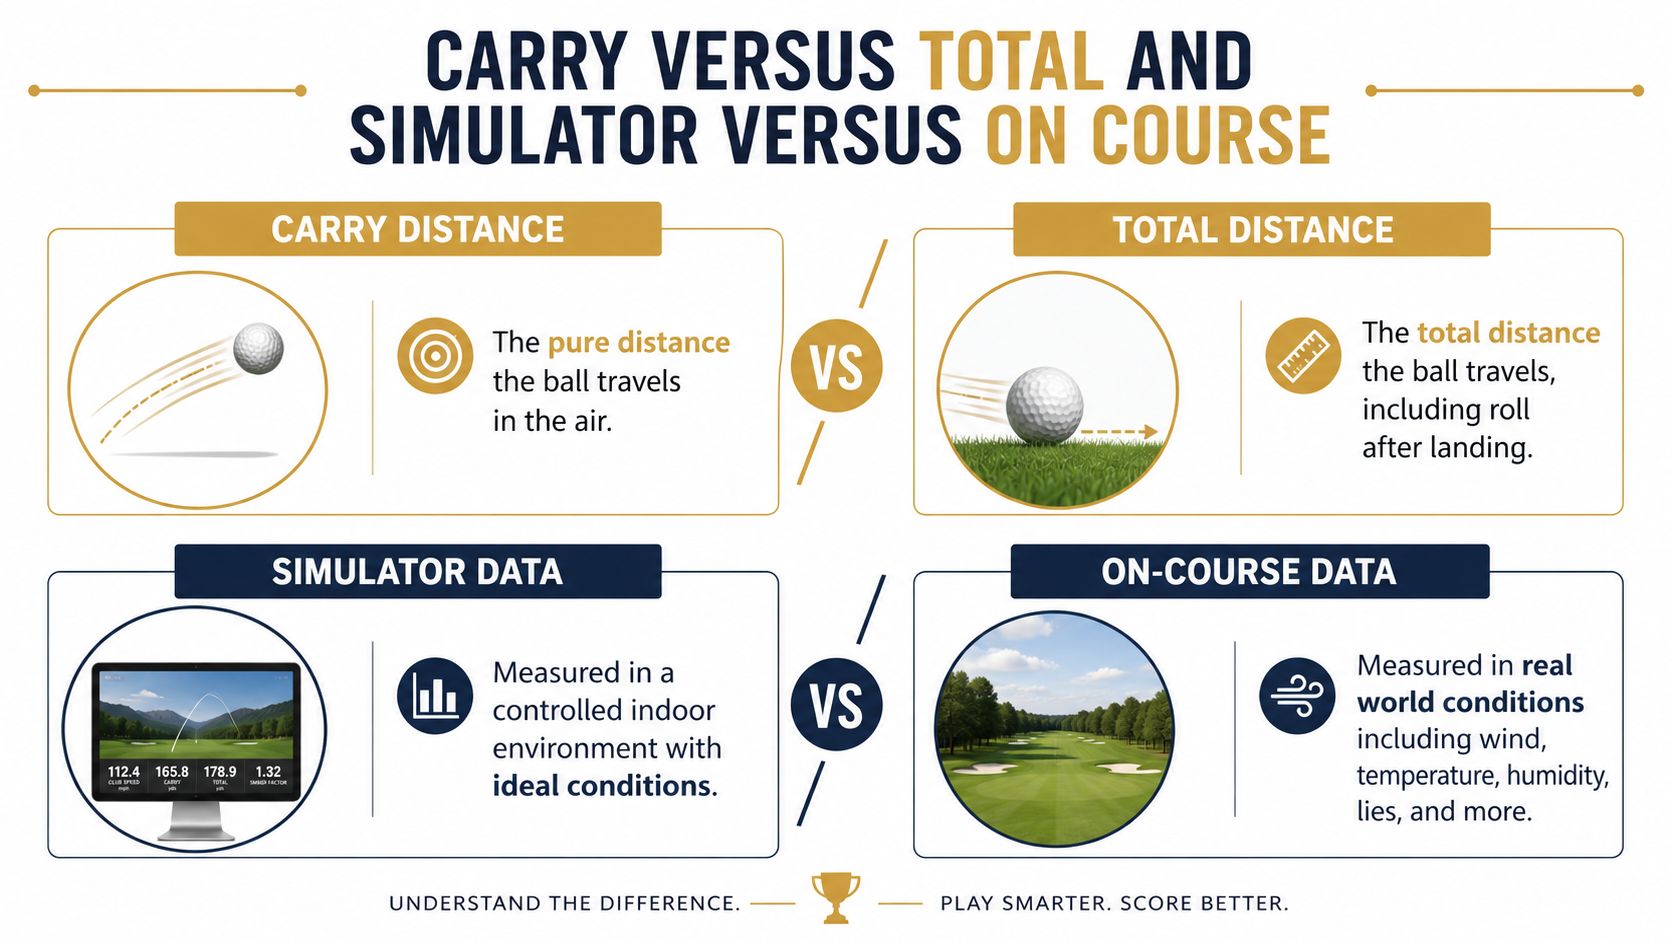
Carry and total distance solve different problems. Carry answers the question, “Will the ball clear the hazard and land in the window?” Total answers a different question, “How far did the ball finish after it landed?” Mixing them makes a golfer overtrust one shot and underprepare for another.
Why carry is the scoring number
On approach shots, carry is the number that protects the scorecard. If the ball has to fly over water, bunker, rough, or a false front, total distance is secondary. Roll only helps once the ball has already survived the first landing.
That doesn't make total distance useless. It belongs to different decisions. A wide landing area, a dry fairway, and a wedge shot with room to release all invite total-distance thinking. A forced carry does not.
Why simulator numbers can differ from course numbers
Simulator data usually runs in more controlled conditions. On-course shots include lies, slope, wind, turf interaction, and the player's actual decision-making. Those variables don't just add noise, they change shot shape and landing behavior.
A golfer who tracks both should label every sample by context. A range session on a mat, a garage sim, and a wind-affected round should never be blended as if they came from one environment. That's how “my 8-iron is 155” becomes a meaningless sentence.
Keep the label attached to the number, or the number will mislead the bag.
The practical adjustment is simple. Compare carry to carry, total to total, and simulator to simulator only when the underlying conditions are similar enough to matter. If they aren't, use the difference as a clue, not as a correction formula.
Why the Same Club Varies So Much by Swing Speed and Skill
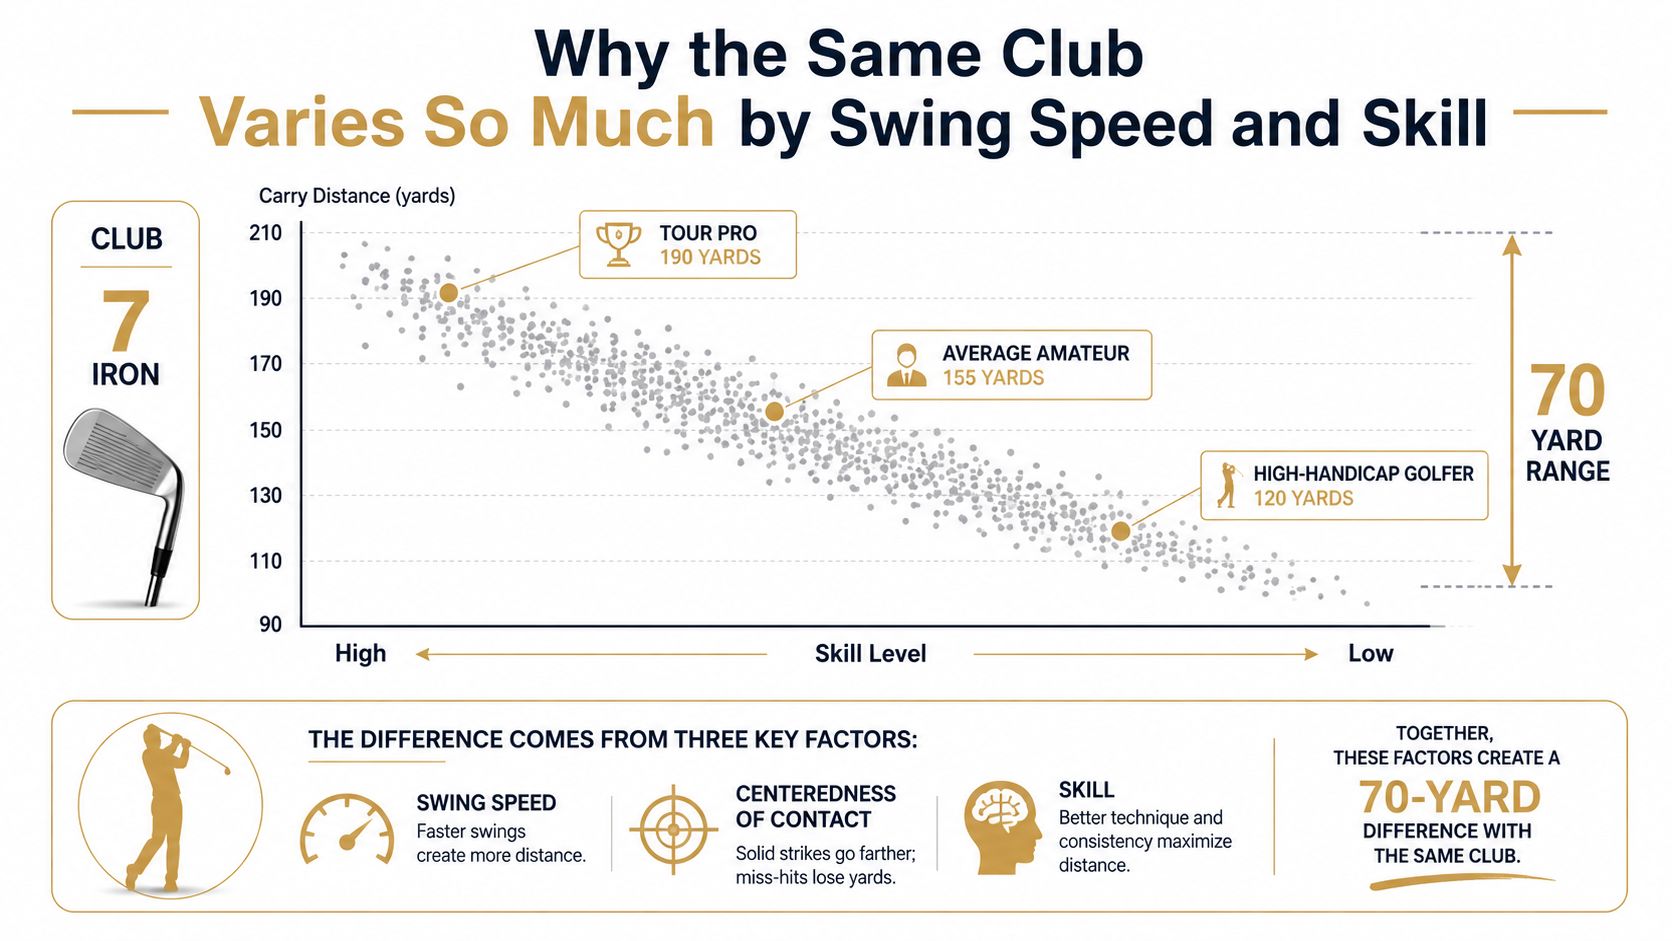
A club's typical distance is not a fixed property of the club. It is the result of swing speed, centered contact, and strike quality working together. That is why driver charts separate player groups so sharply, while wedge numbers usually compress as motion gets shorter and control matters more.
Driver shows the biggest spread
Driver is where the gap between golfer profiles becomes easiest to see. Public benchmarks show a large separation between amateur and tour-level distance, and TrackMan-style summaries point to the same pattern, with faster players producing more ball speed and more carry when contact stays efficient. For launch-based distance thinking, driver ball-speed context is a better lens than a single yardage number.
That spread is not random. Faster swing speed creates more ball speed when the strike is solid, and better players usually lose less on off-center hits. The result is a wider carry window, not just a longer best shot.
Iron and wedge numbers compress, but the logic stays the same
As clubs get shorter, the raw distance gap narrows, but the same pattern remains. A 7-iron can sit in very different carry windows depending on speed and strike quality, which is why a single chart line is easy to misread. The same club can belong to different distance profiles, and that is more useful than treating the club name as the main variable.
Public average tables make this point clearly enough without needing to force a precise claim. The important part is not whether one golfer matches an average. It is whether the golfer's own carry window is stable enough to gap the next club cleanly.
What this means
Typical distance is better treated as a golfer-profile estimate than a club constant. Swing speed sets the ceiling, strike quality sets the usable window, and skill level determines how often the player lives near the middle of that window instead of the edges.
That is why one generic yardage chart only helps as a starting point. A better workflow is to compare your own carry windows by club, then check where the gaps break down. Public averages can frame the range, but they do not build the bag for a specific swing.
Build Your Personal Carry Windows From Launch Monitor Data
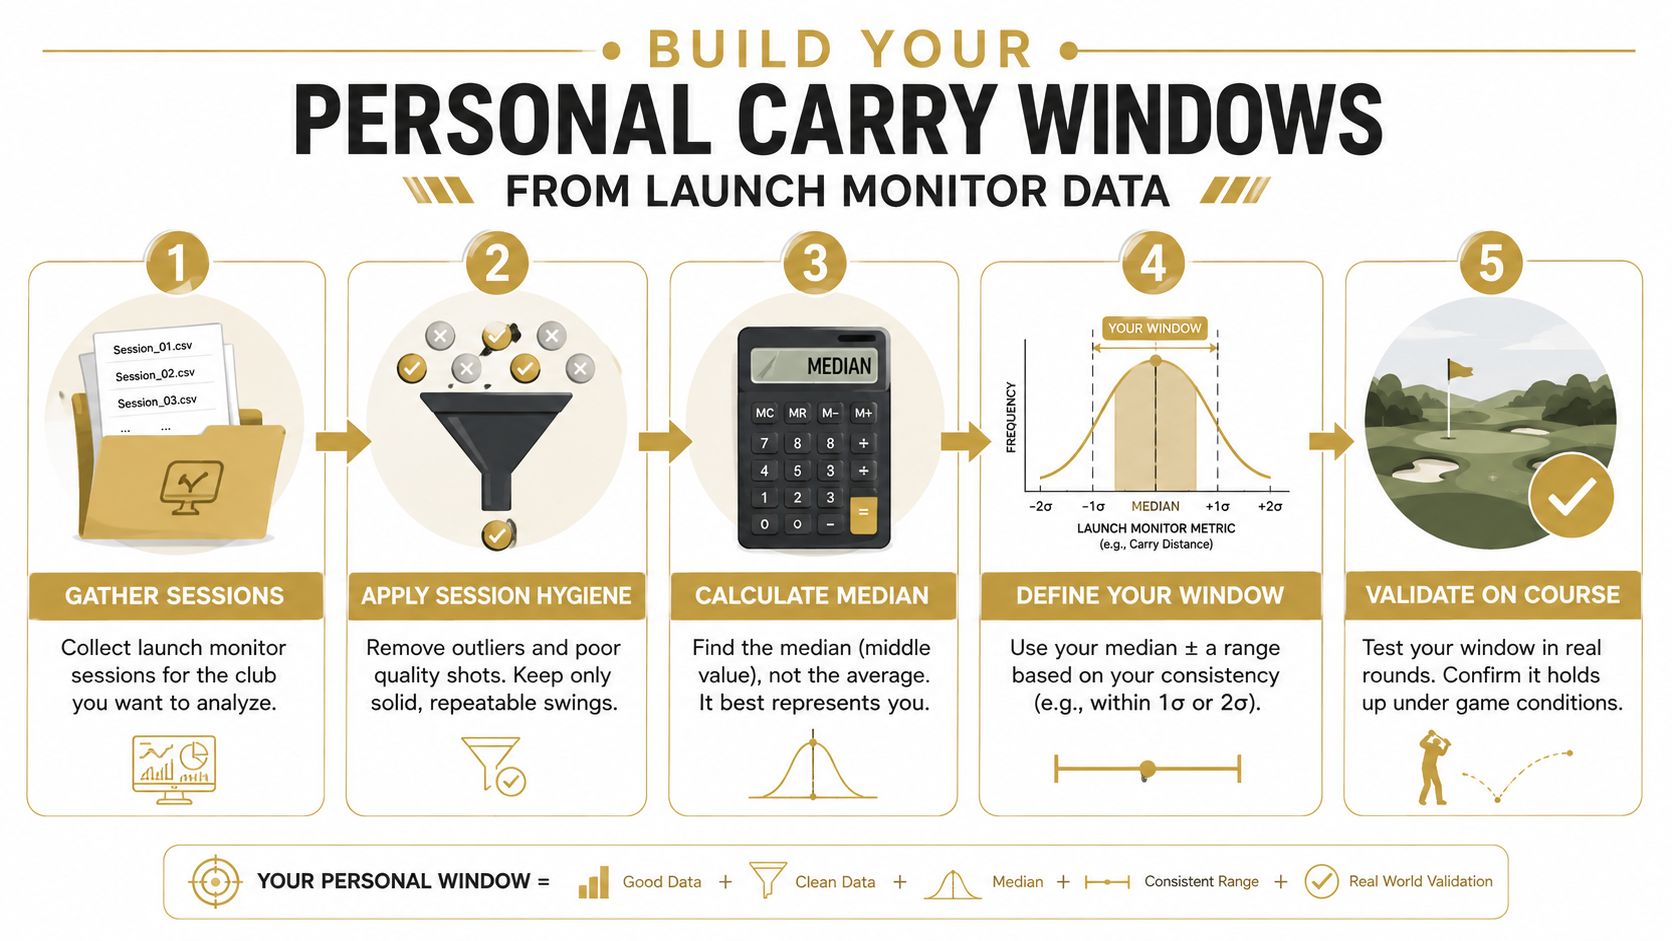
Public charts are starting points. Your own carry windows come from repeatable sessions, clean imports, and a willingness to ignore the best shot in favor of the typical one. That is where launch-monitor exports stop being raw files and start becoming bag data.
Clean the session before you trust the number
Start with a session that shows the pattern, not a pile of noise. Obvious mishits belong in a separate note, not inside the main carry window. The number that matters is the middle of the usable shots, not the longest strike of the day.
The workflow matters more than the app brand. Keep club type, carry, total distance, and side carry organized so each shot can be compared on the same terms. A clear export and import process turns those fields into analysis-ready files, which is what a distance table needs.
Import paths matter more than people think
Cross-platform import matters because golfers rarely stay inside one device setup. Common launch monitors and simulators can feed the same analysis workflow, so session history stays portable instead of trapped in one place (ShotData's analytics import reference).
Dialed Golf Desktop fits into that workflow as a launch-monitor practice layer, with live pairing on desktop and CSV import from several common sources. The point is not brand loyalty. The point is one golfer record that can be queried later without rewriting the session by hand. Launch monitor app workflow notes
Practical rule: if a session cannot be exported, cleaned, and read later, it is practice data, not bag data.
Build windows, not a single yardage line
A carry window is a range with a center, a floor, and a ceiling. That framing is more useful than a single number because it shows where the club is playable and where it starts to leak. The same club can belong to different golfer profiles, so the label on the head matters less than the pattern in the export.
Public averages can still help, but only as context. Compare your own carry windows by club, then look for the gaps that hold up under repeated swings and the gaps that fall apart under pressure. Once those windows are defined, the chart stops being generic and starts showing what to practice next.
Gap Analysis and Practice Priorities for Your Bag
Once the carry windows are set, the next question is where the bag leaks distance, and which leak affects scoring most. That separates a yardage list from a usable decision system.
Find overlaps before hunting for missing yardages
A gap analysis starts with sorting. Put the clubs in carry order, then inspect the space between each pair. If two clubs sit too close together, one is redundant. If the spacing jumps too far, the golfer is forced into a shot shape or swing change that is less repeatable.
The point of the analysis is to turn those carry windows into actions. The gap-analysis workflow for club spacing gives a simple structure for that review, and it works best when the numbers come from repeated swings rather than a single good range session. Distinct intervals matter because they show where the bag covers distance, not where it looks tidy on paper.
Prioritize the gap that affects scoring
The biggest gap is not always the one that deserves attention first. A long-game overlap is inconvenient, but a wedge hole can cost strokes faster because those clubs appear more often near the green. If most approaches come from the scoring range, that cluster deserves the first pass.
The useful question is which gap shows up under pressure. The answer tells the golfer whether to tighten wedge spacing, improve mid-iron separation, or replace a redundant long iron with a club that fits the current swing better.
A simple audit routine
- Sort by carry: Put every club in order from shortest to longest carry.
- Mark tight overlaps: If adjacent clubs behave too similarly, flag the redundancy.
- Mark empty zones: Any stretch with no trustworthy club becomes the priority hole.
- Tie it to the course: The most important gap is the one that appears in scoring positions most often.
- Retest after changes: Any loft, shaft, or ball change can shift the windows enough to reopen old problems.
One useful check is to compare the carry gap against the golfer profile that produced it. A tighter swing-speed band can make two clubs look different on a chart but nearly identical in practice. A wider band can do the opposite, where a club that seems awkward on one day fills a real window when the swing is matched to the right speed and strike pattern. That is why bag work should follow the export, not the memory of the best shot.
That lens keeps practice away from vanity distance. If the golfer knows where the overlaps live, practice can target the club that changes scores.
Quick Reference Carry Chart and Re Test Plan
A good distance system should fit on one page. The golfer needs the current carry windows, the clubs that cover scoring distances, and a date to revisit the numbers before they drift. A printed or saved chart beats memory because memory changes when the round gets tense.
What to keep in the quick reference
The most useful sheet is a short bag ladder with three columns, club, carry, and confidence. Confidence can be informal, but it should reflect whether the number came from repeated sessions or from a single hot range day. The golfer should also add a note for any club that tends to run long or short relative to the rest of the set.
That quick reference becomes more reliable when it's updated after equipment changes, swing changes, or a long gap away from the course. The point is not perfection. The point is a current chart that reflects the golfer's present swing rather than a memory from last season.
Dialed Golf connects that workflow with three products, one golfer record, one Pro plan. The consumer app acts as a pocket caddy on the course in TestFlight, desktop supports launch-monitor practice with live pair first on Garmin R10 and expanding support, and free web tools stay free while Golfer Pro runs across app and desktop at $9.99/week, $29.99/month, $149.99/6 months, and $249.99/year. Dialed Academy sits separately for ranges and clubs at $99.99/month or $999.99/year, with the club keeping its dues.
A simple re-test rhythm
The chart should be revisited after any meaningful equipment adjustment, after a swing change that alters contact pattern, and after enough rounds to show whether the old window still holds. A golfer doesn't need constant retesting, just a system that prevents stale numbers from running the bag.
That's the payoff of working from typical distance for golf clubs as a golfer profile instead of a fixed chart. Once the golfer has a personal carry map, a gap audit, and a re-test habit, the bag stops guessing.
Dialed Golf is built for golfers who want their distances tied to actual sessions, not generic charts. The app, desktop workflow, and free tools all support the same idea, one golfer record that can hold carry windows, gapping, and course decisions in one place. Visit Dialed Golf to see how the distance workflow fits a launch-monitor practice routine and a course-day pocket caddy.