

Most golfers are told to chase a bigger average driving distance. That advice is incomplete, and for many players it points practice in the wrong direction. Amateur distance has stayed nearly flat, while professional distance continues to rise, so the useful question isn't how far golfers drive. It's how far a golfer of a particular age, skill level, gender, and measurement context should expect to drive, and whether that benchmark helps lower scores.
The historical baseline makes the gap clear. In the final year of the R&A and USGA amateur study, male amateurs averaged 216 yards and female amateurs averaged 147 yards in 2019. Nearly 70% of the golfers studied averaged under 250 yards, and 88% of shots were hit with a driver, according to the R&A and USGA amateur driving-distance analysis. That is a far more useful starting point than comparing an everyday golfer with a tour professional.
Table of Contents
- Why a Single Average Driving Distance Number Misleads Golfers
- Average Driving Distance Benchmarks by Skill Level and Demographics
- The Surprising Truth About Distance Trends Over Time
- How to Measure Your Own Driving Distance with Launch Monitor Data
- Turning Distance Data into Practice Goals and Fitting Decisions
- Building a Long-Term Distance Tracking Routine
Why a Single Average Driving Distance Number Misleads Golfers
A single average driving distance number looks precise, but it often answers the wrong question. A scratch golfer in their twenties and a 15-handicap golfer in their sixties may both ask for the “average,” yet their relevant benchmarks are completely different. Age, handicap, gender, strike quality, launch conditions, and measurement method all change what the number means.
Recent amateur data illustrates the spread. The average male amateur reached 224.1 yards in 2025, while scratch golfers averaged about 250 yards and players in their teens averaged around 218 yards, according to recent age and handicap driving-distance analysis. The same analysis indicates that a 12-handicapper loses roughly 32 yards from their twenties to their sixties and about 40 yards from their thirties to their seventies. A golfer who compares only with the overall male average may therefore misread both a strength and a weakness.
Carry and total distance answer different questions
Carry distance measures how far the ball travels through the air before landing. Total distance includes rollout after landing. Carry matters more when a golfer needs to clear a hazard, reach a fairway section, or plan a shot into a headwind. Total distance matters more when fairways are firm and the next shot depends on the final resting position.
Neither figure is universally superior. A launch monitor session may emphasize carry, while on-course tracking generally captures the ball's final position. A golfer comparing those numbers without labeling them can mistake a measurement difference for a swing change.
Conditions can move the result
Wind direction, temperature, elevation, turf firmness, and fairway conditions alter total distance. The shot also behaves differently when struck under pressure on the course than when hit from a controlled range station. A range session can reveal a player's potential, while on-course data reveals the distance that survives a round.
Practical rule: A defensible benchmark should identify whether it measures carry or total distance, where the shots were hit, and whether mishits remain in the sample.
The better approach is to build a personal range. That range should include a typical result, a realistic upper result, and the dispersion attached to both. A headline average may satisfy a search query, but a golfer improves by understanding the distance produced by a repeatable strike.
Average Driving Distance Benchmarks by Skill Level and Demographics
The most useful benchmark compares a golfer with a relevant peer group, not with elite professionals. The available amateur data places the average male at 224.1 yards in 2025 and the average female at 175.7 yards, with handicap bands producing substantial separation, as documented in the 2025 amateur distance breakdown.
| Player Category | Average Driving Distance (Yards) | Key Context |
|---|---|---|
| Male amateurs | 224.1 | 2025 average, total-distance context |
| Female amateurs | 175.7 | 2025 average, total-distance context |
| Male scratch golfers | About 250 | Skill-specific benchmark |
| Male golfers in their teens | Around 218 | Age and handicap data show wide variation |
| Male amateurs, 2019 | 216 | R&A and USGA historical baseline |
| Female amateurs, 2019 | 147 | R&A and USGA historical baseline |
| PGA Tour | 302.8 | 2025 annual tour average |
| DP World Tour | 297.8 | 2025 annual tour average |
| LPGA Tour | 259.8 | 2025 annual tour average |
| Korn Ferry Tour | 308.4 | 2025 annual tour average |
The professional figures come from the USGA 2025 Distance Report. They aren't interchangeable with amateur on-course figures. Tour driving distance uses a defined measurement process, while amateur reports may reflect total distance on actual course shots. That distinction matters before a golfer draws conclusions about performance.
Skill creates a wider split than most golfers expect
The amateur data indicates that handicap bands differ sharply. Better players generally combine more speed with better strike quality and more reliable launch conditions. A golfer with modest speed can still create a useful benchmark by separating centered strikes from mishits, rather than treating every drive as equally representative.
The 2019 R&A and USGA baseline remains valuable because it captures everyday golfers rather than only elite competitors. Male amateurs averaged 216 yards, female amateurs averaged 147 yards, and nearly 70% of the studied amateur golfers averaged under 250 yards in that study. The result anchors “average” in the broader golf population.
For a related look at how driver speed connects with distance output, golfers can use this driver ball speed chart as a companion reference. The important discipline is to treat any benchmark as a starting point, not a verdict. A golfer's own carry window, strike pattern, and dispersion determine the practical target.
The Surprising Truth About Distance Trends Over Time
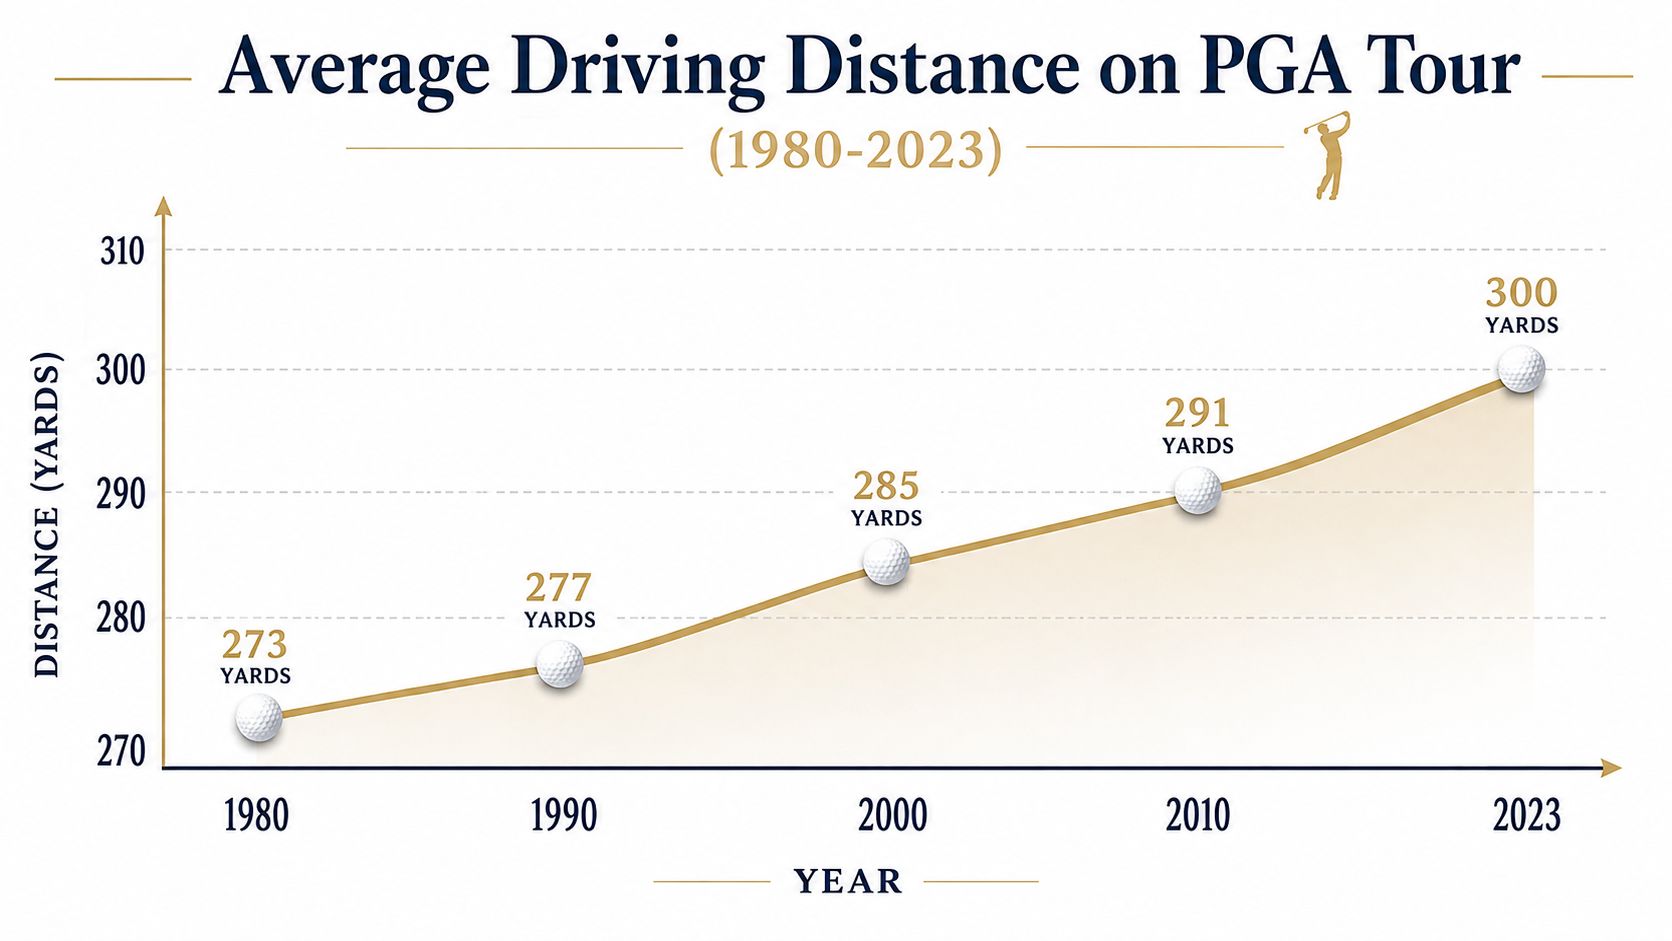
The popular story says golfers keep hitting the ball farther every year. That story fits professional golf better than amateur golf. The PGA Tour measured average rose from 256.89 yards in 1980 to roughly 302.8 yards at the end of 2025, a long-run gain of about 46 yards, according to PGA Tour driving-distance history.
The USGA's broader comparison adds nuance. Average driving distance across major professional tours increased by about 4.0% since 2003 through the end of the 2024 season, while the PGA Tour averaged 287 yards in 2003 and was 14.3 yards longer in 2024, according to the USGA 2024 Distance Report. The historical jump was larger before 2003, and recent changes can be small, flat, or slightly down depending on the tour.
Amateur distance tells a different story
Arccos-based reporting shows male amateurs at 224.1 yards in 2025, compared with 224.0 yards in 2018. Women declined from 179.2 yards to 175.7 yards over the same period, according to reporting on the recent amateur distance trend. Amateur distance has therefore been flat, even as professional tours continue to post much larger numbers.
That divergence changes the improvement conversation. Professionals have access to optimized equipment, specialized physical preparation, technical coaching, and repeated practice under controlled conditions. Everyday golfers have variable contact, inconsistent launch, limited practice time, and course conditions that can hide or exaggerate changes.
The mistake is to treat a professional trend as a personal obligation. If amateur distance has barely moved, a golfer may gain more by improving strike consistency, identifying carry gaps, or reducing wayward drives than by chasing a tour-style distance target. Professional numbers describe the upper edge of the sport. They don't define a sensible benchmark for every golfer.
How to Measure Your Own Driving Distance with Launch Monitor Data
A personal benchmark starts with a repeatable session, not the longest drive of the day. The golfer should use the same driver, ball type, setup, and launch-monitor position whenever possible, then record both carry and total distance. A reliable baseline comes from multiple sessions, because one range visit can reflect unusual wind, fatigue, timing, or contact.
Build a clean session
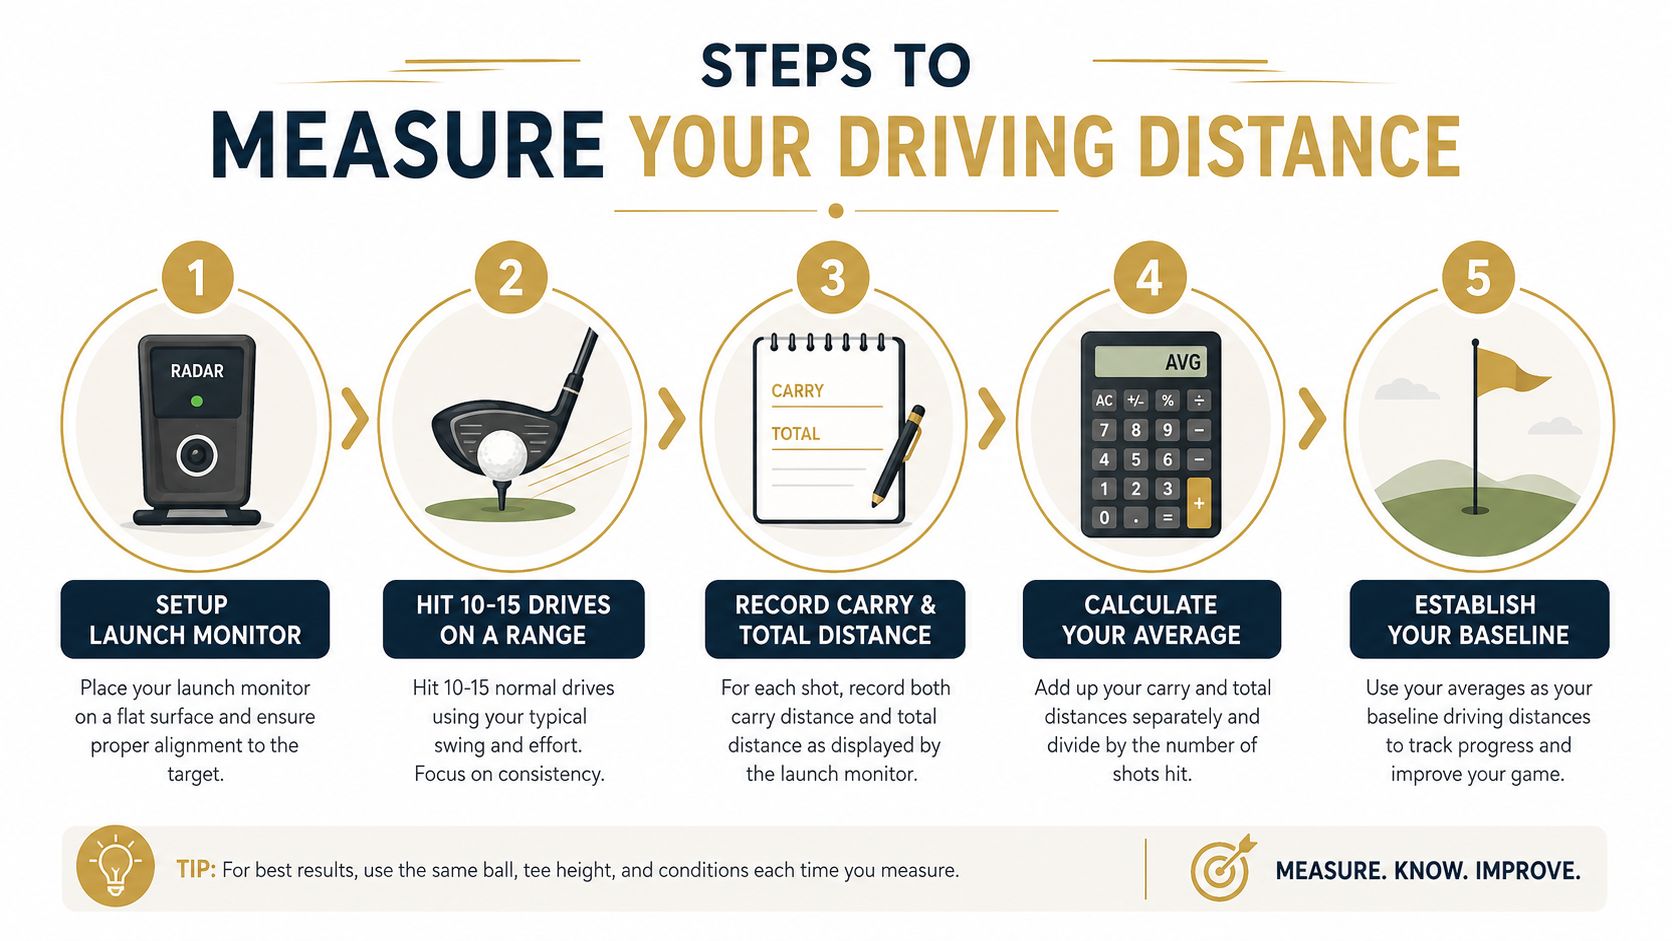
The practical sequence is straightforward:
- Set up the launch monitor carefully. Confirm alignment, target direction, ball position, and indoor or outdoor mode before hitting. A small setup error can make a session less useful than the swing itself.
- Hit 10 to 15 drives. This creates enough observations to expose inconsistency without turning the session into an endurance test. The prescribed session range is shown in the launch-monitor guide for driving-range practice.
- Record carry and total distance separately. Carry supports course planning, while total distance helps evaluate rollout and actual finishing position.
- Review the strike pattern. A severely mishit ball shouldn't define the golfer's normal driver distance, but it also shouldn't disappear from an accuracy review. Keep a clean benchmark sample and a separate dispersion record.
- Repeat across sessions. A personal baseline becomes credible when it survives different days and conditions.
Garmin support documentation states that session data from an Approach R10 or Approach R50 can be exported from the Garmin Golf app by opening Activity, selecting a session, and choosing Export to CSV, as described in Garmin's CSV export instructions. CSV files make it possible to examine sessions on a desktop rather than relying on memory or a single displayed average.
A desktop workflow can pair live with compatible launch-monitor hardware first, then accept imported session files from several ecosystems. The key is consistency. A file containing carry, total distance, and dispersion lets the golfer compare like with like instead of mixing a controlled range number with an on-course total.
The process can also be demonstrated visually:
Data habit: Keep the raw session file. A later swing change may make an old session relevant, and raw data preserves the context that a handwritten average loses.
Turning Distance Data into Practice Goals and Fitting Decisions
Distance becomes useful when it changes a decision. A golfer who knows only the average may feel informed, but a golfer who knows carry range, total range, strike quality, and dispersion can choose a more precise practice target. The question is whether the driver is limited by speed, contact, launch, equipment, or strategy.
Read the pattern before changing the swing
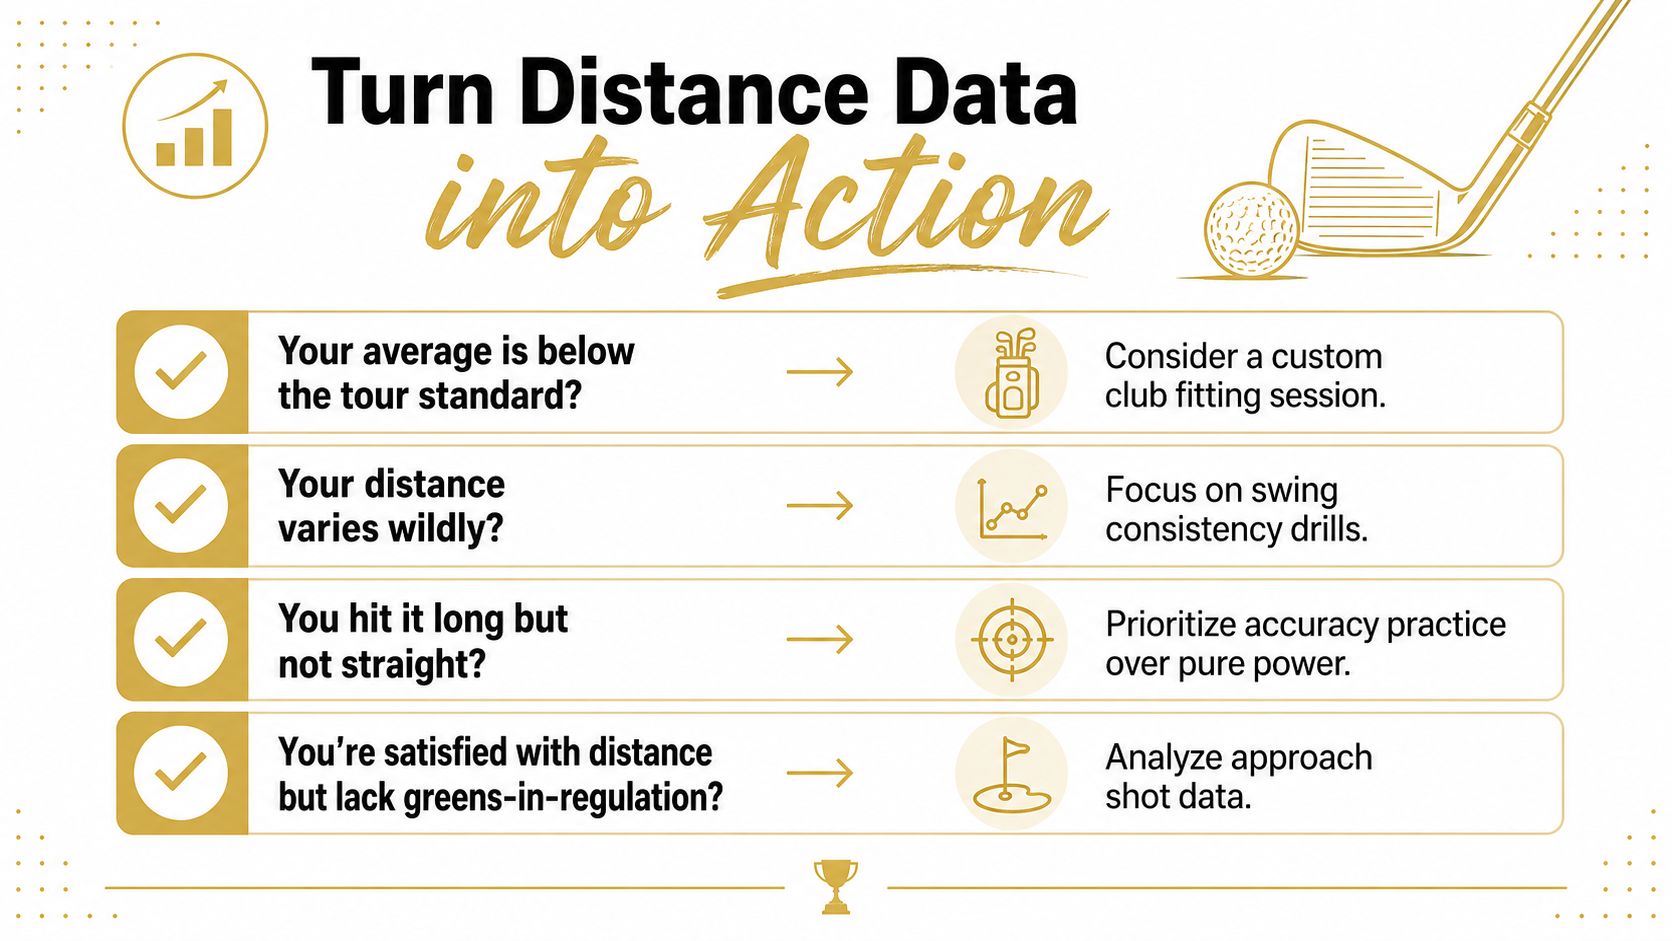
A low average with a tight cluster suggests a different problem from a wide range of results. The first golfer may need a fitting or a launch adjustment. The second may need centered-contact drills before adding speed.
A long average with severe dispersion also needs careful interpretation. If the longest drives create difficult recovery positions, raw distance isn't producing its full scoring value. The golfer should compare distance with fairway outcome, approach-shot position, and the frequency of penalty or recovery situations.
A practical decision tree looks like this:
- Below a relevant benchmark: Check strike, launch, and equipment before assuming the golfer needs a wholesale swing rebuild.
- Large variation between drives: Prioritize contact and setup consistency. A stable delivery can raise the usable average without increasing maximum speed.
- Strong distance with poor direction: Shift practice toward start line, face control, and dispersion rather than chasing more speed.
- Adequate driver distance but weak scoring: Analyze approach-shot distance and gapping. More driver yards won't solve a repeated wedge or mid-iron gap.
The gap analysis tool helps frame the driver within the whole bag. That matters because a driver number has no strategic meaning if the next club leaves an awkward distance or if the golfer repeatedly faces approach shots outside a comfortable carry window.
Set targets that survive the course
A realistic practice goal is measurable and specific. Examples include improving the proportion of centered strikes, narrowing the carry range, or raising the reliable carry without increasing the miss pattern. The target should reflect the golfer's age, skill, and current baseline, not a professional tour average.
Dialed Golf can serve this workflow as a desktop-first launch-monitor practice product, with live pairing beginning around Garmin R10 and expanding, plus CSV and import workflows for Garmin, Rapsodo, SkyTrak, FlightScope, Uneekor, GSPro, Awesome Golf, and more. It also connects the golfer record across a consumer pocket-caddy app and desktop practice, while free web tools remain free and Golfer Pro covers app and desktop access at $9.99 per week, $29.99 per month, $149.99 for six months, or $249.99 per year. Those prices are listed in the product information supplied for Dialed Golf.
The measurement should guide the change. A golfer doesn't need more data for its own sake. The golfer needs the smallest useful diagnosis that turns a distance pattern into a better practice choice.
Building a Long-Term Distance Tracking Routine
Distance tracking works best as a periodic audit, not a permanent distraction. A golfer can schedule dedicated benchmark sessions at consistent intervals, then leave ordinary practice available for technical work, wedge play, and on-course decision-making. The point is to detect a durable change, not to react to every unusually good or poor day.
Each benchmark entry should include:
- Date and setting: Record whether the session happened outdoors, indoors, on a range, or during a round.
- Equipment details: Keep the driver, ball, tee height, and setup consistent when possible.
- Carry and total: Store both values rather than collapsing them into one distance.
- Typical result: Note the central cluster, not only the longest shot.
- Dispersion: Record the shape and width of misses.
- Conditions: Mark wind, firmness, temperature, and elevation qualitatively.
Comparisons need the same measurement language. A launch-monitor carry average shouldn't be placed directly beside an on-course total average and treated as a trend. If conditions change, the golfer should label the difference rather than forcing the numbers into a false conclusion.
Age and skill also affect what progress looks like. A younger, higher-handicap golfer may have more room to improve strike and speed, while an older golfer may create better scoring outcomes by preserving a dependable carry window and improving accuracy. The useful gain is the one that remains available under normal playing conditions.
Long-term standard: A benchmark is valuable when another session can reproduce it, explain its conditions, and show what changed.
The tracking routine can stay simple. One row per session, one consistent definition of distance, and a short note about the swing or equipment change are enough to reveal whether an adjustment worked. Over time, that record replaces vague comparisons with evidence the golfer can defend.
Dialed Golf brings the distance record into the same golfer profile used for course play and desktop practice. Dialed Academy also provides range and club operators with membership and front-desk software at $99.99 per month or $999.99 per year, while clubs keep their dues, according to the supplied product information. The consumer app is currently distributed through TestFlight rather than general App Store availability, and the desktop experience is the primary live-pair environment.
Use Dialed Golf to turn launch-monitor sessions and imported CSV files into a consistent personal distance record. Start with one clean driver baseline, track carry, total distance, and dispersion, then use the resulting pattern to choose smarter practice and fitting decisions.