

A golfer stands over a launch-monitor screen after a range session, staring at a driver speed number and wondering what it should mean on the course. The monitor reports club speed, ball speed, launch, spin, carry, and total distance, but the numbers don't always line up with the chart found online.
That confusion is understandable. A golf swing speed and distance chart is useful, but it isn't a promise. It's a baseline for comparing speed, strike quality, launch conditions, and real carry windows. Used properly, it helps golfers spot distance gaps, evaluate equipment, and decide whether a lost yard is a swing problem, a fitting problem, or a bad shot.
Table of Contents
- Why Swing Speed Charts Matter for Real Golfers
- The Core Relationship Between Speed and Distance
- Reading the Main Golf Swing Speed and Distance Chart
- Variables That Shift Your Actual Distance From the Chart
- Using the Chart for Bag Gapping and Fitting Decisions
- Tracking Your Own Speed and Distance Data Over Time
- Modern Distance Cliffs and Future Benchmark Shifts
- How Coaches and Fitters Use Charts in Real Sessions
- Validating Your Distance Data Against the Chart
- Next Steps for Deeper Data Analysis and Practice
Why Swing Speed Charts Matter for Real Golfers
Most golfers first use a swing speed chart as a quick lookup. They see a driver speed, find the matching distance, and decide whether their launch-monitor result is good or disappointing. That approach misses the chart's real value.
A chart gives the golfer a reference point. If a session produces a driver speed near a familiar speed band but the carry distance sits well outside the expected window, the next question shouldn't be, “Why am I not hitting the number?” It should be, “What happened between the club and the ball?”
That distinction changes a practice session. A golfer with moderate speed but efficient contact may carry the ball farther than a faster player who strikes it low on the face or adds excessive spin. Conversely, a player may gain club speed without seeing a matching carry increase because launch and strike quality have deteriorated.
A baseline, not a verdict
The chart helps with three practical jobs:
- Gapping: It provides an initial expectation for how far clubs may travel, making overlaps and missing yardages easier to identify.
- Fitting: It gives a speed context for testing loft, shaft profile, ball, and launch conditions.
- Progress tracking: It helps separate a genuine speed change from a single unusually good or poor session.
The reference is strongest when paired with the golfer's own data. Launch-monitor exports can show whether distance changes come from speed, ball speed, centered contact, or a different launch window. A single driver number can't provide that diagnosis.
Practical rule: Use the chart to ask better questions, not to assign a permanent distance identity.
Carry also deserves priority. Total distance depends on landing conditions and roll, while carry tells the golfer whether a shot can clear a hazard, reach a fairway section, or hold a target. That's why the chart should begin with carry and use total distance as supporting context.
The Core Relationship Between Speed and Distance
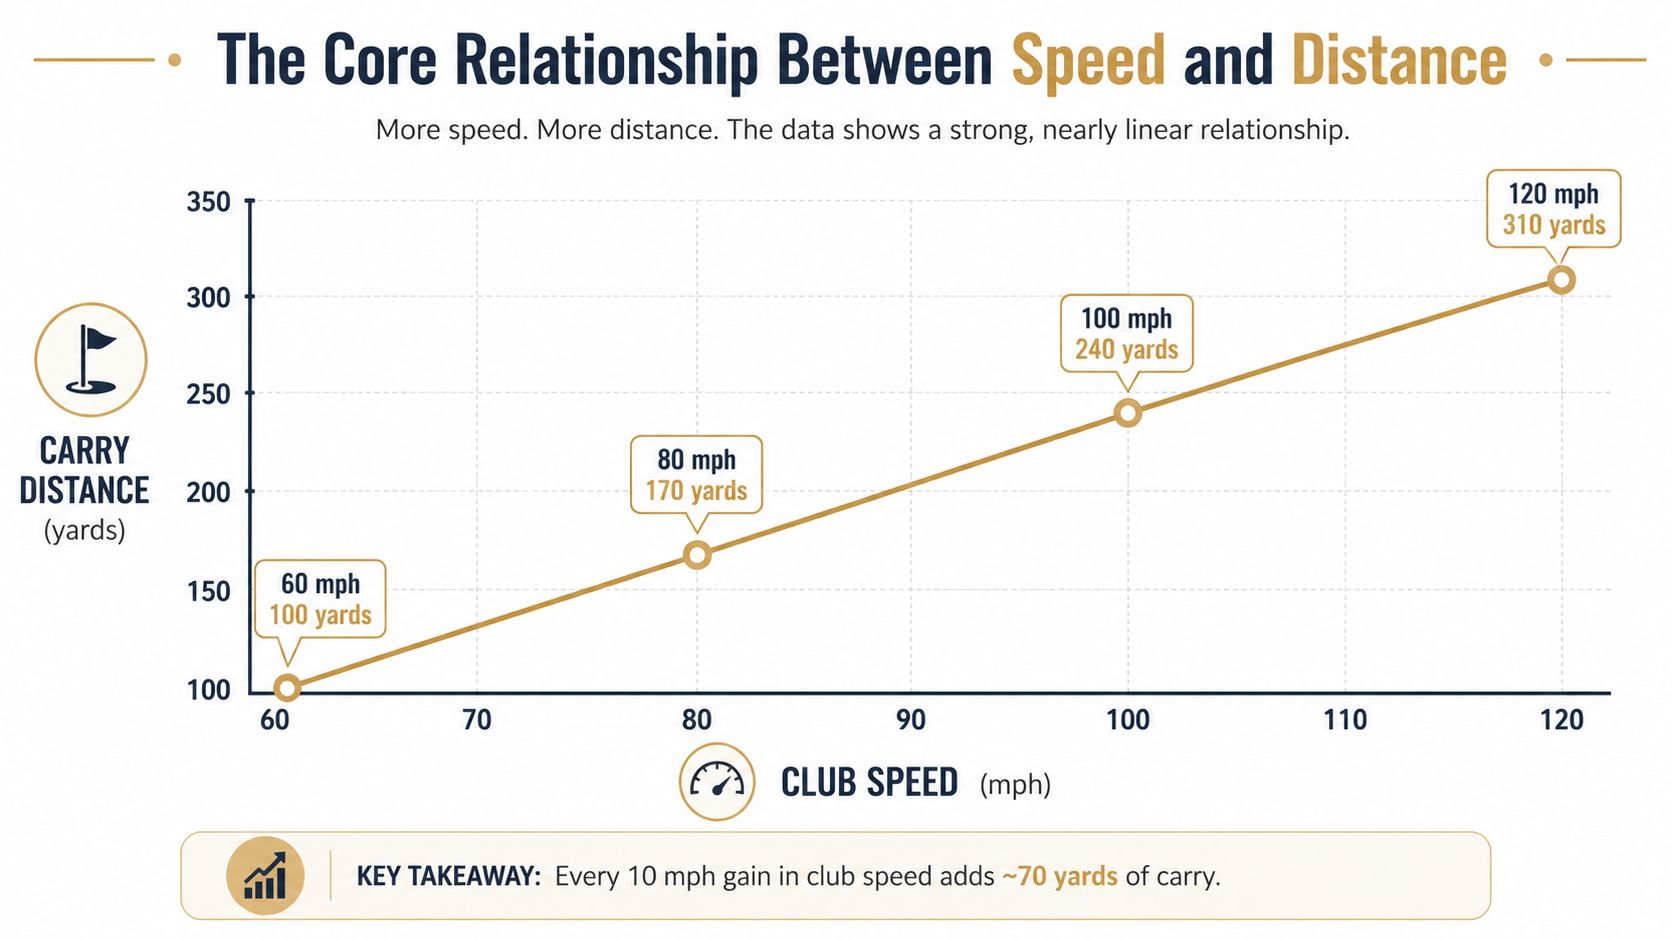
Club speed matters because it sets the ceiling for how much energy the golfer can transfer to the ball. A widely cited independent chart shows a near-linear relationship across a broad range. At 70 mph, estimated carry is 165 yards and total distance is 181 yards, while at 110 mph, carry reaches 280 yards and total distance reaches 304 yards. Those benchmarks are documented in this driver swing speed and distance reference.
The same chart places golfers into useful carry bands:
| Driver swing speed | Estimated carry |
|---|---|
| Below 80 mph | Below 200 yards |
| 80 to 90 mph | 200 to 230 yards |
| 90 to 100 mph | 230 to 257 yards |
| 100 to 110 mph | 257 to 280 yards |
| Above 110 mph | 280+ yards |
Across much of that range, the progression implies roughly 15 yards of additional carry for every 5 mph of added speed. That isn't a universal conversion, because strike and launch conditions can move the result, but it explains why a seemingly modest speed gain can change a golfer's club selection and course strategy.
Why the relationship is useful
A player below 80 mph shouldn't evaluate distance against the same benchmark as a player above 110 mph. The speed band establishes the starting point, then ball speed and launch conditions explain how efficiently the golfer uses it.
Another independent chart gives a different example set. It reports approximately 214 yards of total distance at 93 mph and roughly 280 yards of total distance at 100 mph in its example table, while an industry guide places the requirements for about 250 yards of carry near 101 to 102 mph and 300 yards of total distance near 110 to 111 mph. Those figures appear in this swing-speed distance chart.
The differences between charts are useful rather than problematic. They show that distance depends on the assumptions behind each model, including strike, launch, spin, and whether the chart reports carry or total distance. A golfer should use the chart to establish a range, then replace that range with measured personal data.
Reading the Main Golf Swing Speed and Distance Chart
The table below combines the practical speed bands and the corresponding reference distances from the independent charting data. It's designed for a quick first comparison, not as a guarantee for every golfer.
Driver Swing Speed to Distance Conversion Chart
| Swing Speed (mph) | Estimated Carry (yards) | Estimated Total (yards) | Speed Band |
|---|---|---|---|
| Below 80 | Below 200 | Not fixed | Slower speed |
| 80 to 90 | 200 to 230 | Not fixed | Developing speed |
| 90 to 100 | 230 to 257 | Not fixed | Moderate speed |
| 100 to 110 | 257 to 280 | Not fixed | High speed |
| Above 110 | 280+ | 304 at 110 mph reference | Very high speed |
Start with the club-speed average from a representative session, not the fastest swing displayed on the screen. Find that speed in the first column, then use the carry range as the initial benchmark. If the golfer's measured carry falls outside the range, inspect ball speed, strike location, launch, and spin before changing equipment.
Carry is the number used for hazards and landing targets. Total distance includes rollout, so it can vary sharply with turf firmness, slope, wind, and landing angle. A drive that reaches a certain total distance on a firm range may not carry that far on the course.
For a second perspective on driver performance, golfers can compare speed with ball speed and efficiency using the driver ball speed chart. The important habit is to record both carry and total distance, then make course decisions primarily from carry.
Variables That Shift Your Actual Distance From the Chart
Two golfers can swing at the same speed and produce noticeably different carries. The difference usually comes from how efficiently the club delivers energy to the ball, not from the speed number alone.
A practical fitting benchmark places a 90 mph driver swing around 129 to 132 mph ball speed, 13 to 16 degrees of launch, 2,630 to 3,100 rpm of spin, and 203 to 214 yards of carry. At 100 mph, the corresponding ranges are approximately 144 to 148 mph ball speed, 12 to 15 degrees of launch, 2,540 to 3,100 rpm, and 235 to 247 yards of carry, as outlined in this driver angle-of-attack and launch benchmark.
The main distance variables
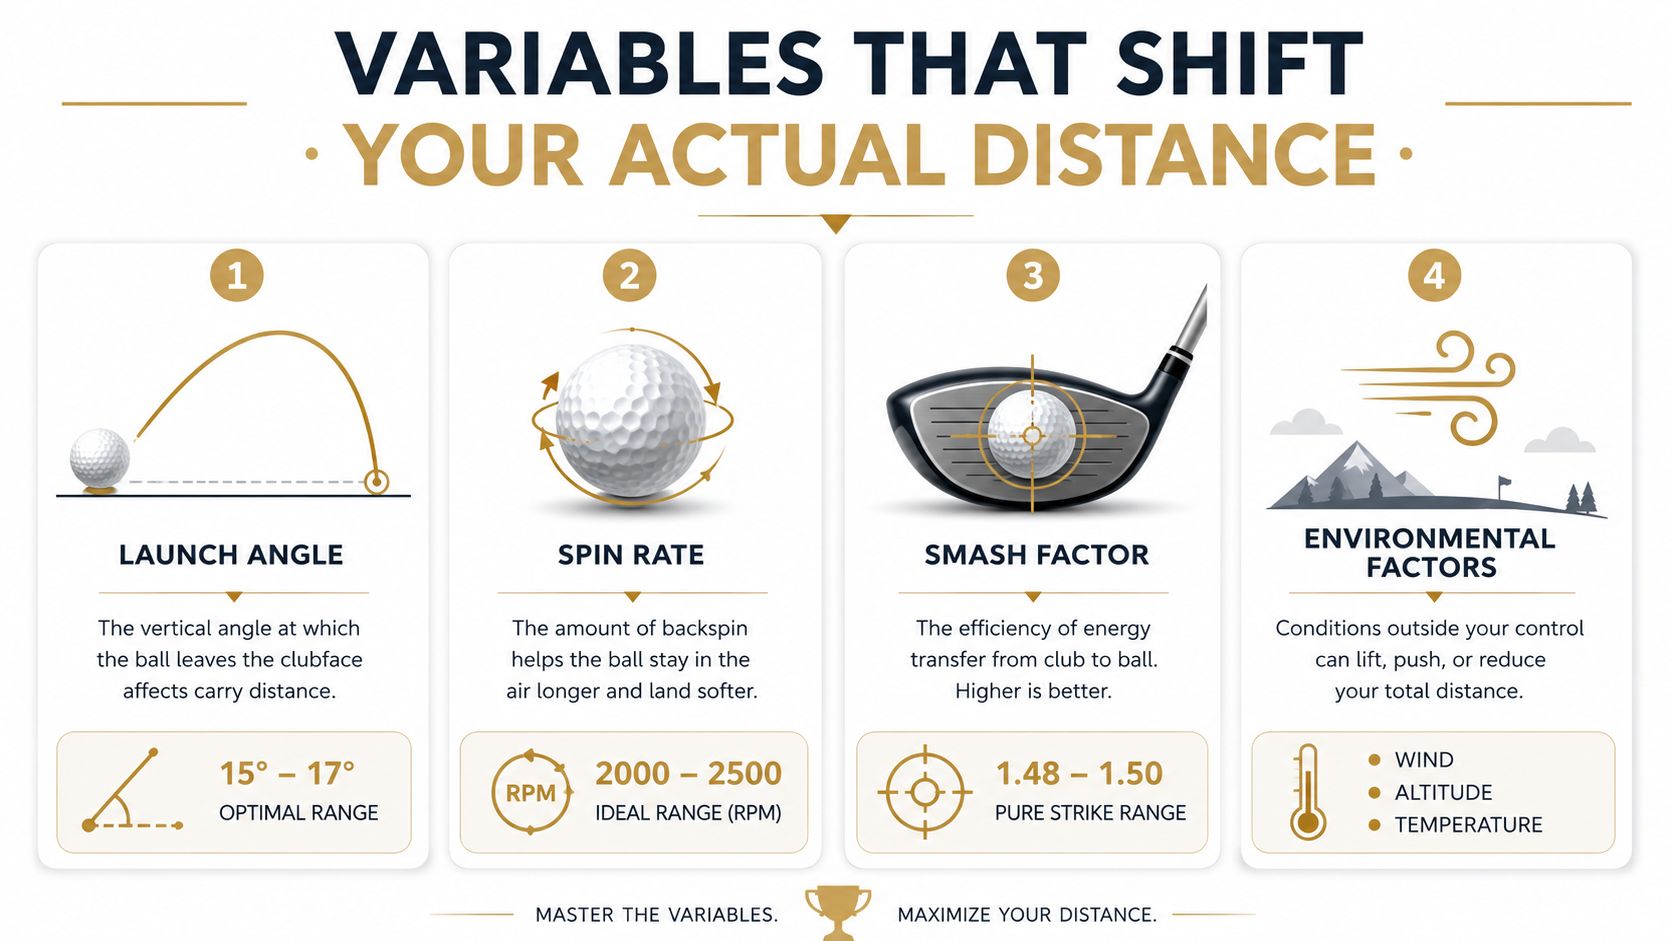
- Launch angle: A launch that's too low can reduce carry, while a launch that's too high may add excess height without useful forward travel. The benchmark infographic uses 15 to 17 degrees as an optimal launch example.
- Spin rate: Spin affects height, descent, and how much energy remains in the flight. The infographic identifies 2,000 to 2,500 rpm as an ideal example range for the comparison.
- Smash factor: Ball speed divided by club speed reveals strike efficiency. A value of 1.48 to 1.50 indicates a pure driver strike in the infographic's benchmark.
- Environment: Wind, altitude, temperature, slope, turf, and range-ball conditions can all change what the golfer sees without changing the swing.
Launch and spin shouldn't be judged independently. A golfer may need more launch with a particular spin profile, while another player may need a different combination because of angle of attack and strike location. Changing loft without checking the resulting launch and spin often creates a new problem.
The chart becomes much more useful when these variables sit beside it. A golfer who is short at 90 mph with poor ball speed has an efficiency issue. A golfer with strong ball speed but a poor launch window has a delivery or fitting issue. The remedy won't be the same.
Using the Chart for Bag Gapping and Fitting Decisions
A driver speed band can guide equipment testing, but it shouldn't dictate a shaft label or loft choice by itself. Flex, weight, torque, length, head design, loft, angle of attack, and tempo all influence the result. The right setup is the one that produces a repeatable launch window and usable dispersion, not the one attached to a particular speed category.
Start by building a club-by-club carry list. If two clubs finish near the same carry, the golfer has redundancy. If there's a large distance hole between clubs, the bag needs a loft review, a different club type, or a change in how the player delivers one of the clubs. A structured gap analysis for the golf bag turns that observation into a fitting decision.
Turning speed into a test plan
A golfer can use the chart to narrow the questions:
- Test the current driver first. Record club speed, ball speed, launch, spin, carry, total distance, and strike location.
- Change one variable at a time. Test loft or shaft profile separately where possible, otherwise the results become difficult to interpret.
- Check the landing window. A longer total distance isn't automatically better if carry becomes less predictable.
- Review the top of the bag. If the driver and fairway clubs overlap, or if a long iron fails to create a reliable carry gap, the chart has exposed a course-management issue.
- Evaluate the ball alongside the club. A ball that changes launch or spin can alter the distance profile even when the club remains unchanged.
Shaft flex should be selected from the complete delivery, not from speed alone. A fitter looks at tempo, transition, release, strike, launch, spin, and dispersion before recommending a profile. The chart starts the conversation. It doesn't finish it.
Tracking Your Own Speed and Distance Data Over Time
A chart gives you a starting range. Your own launch-monitor record shows whether a club produces a reliable carry window. Build that record around repeatable swings and use it as a gapping and fitting baseline, not as a promise of maximum distance. Track club speed alongside carry, ball speed, launch, spin, and strike quality.
A clean data workflow
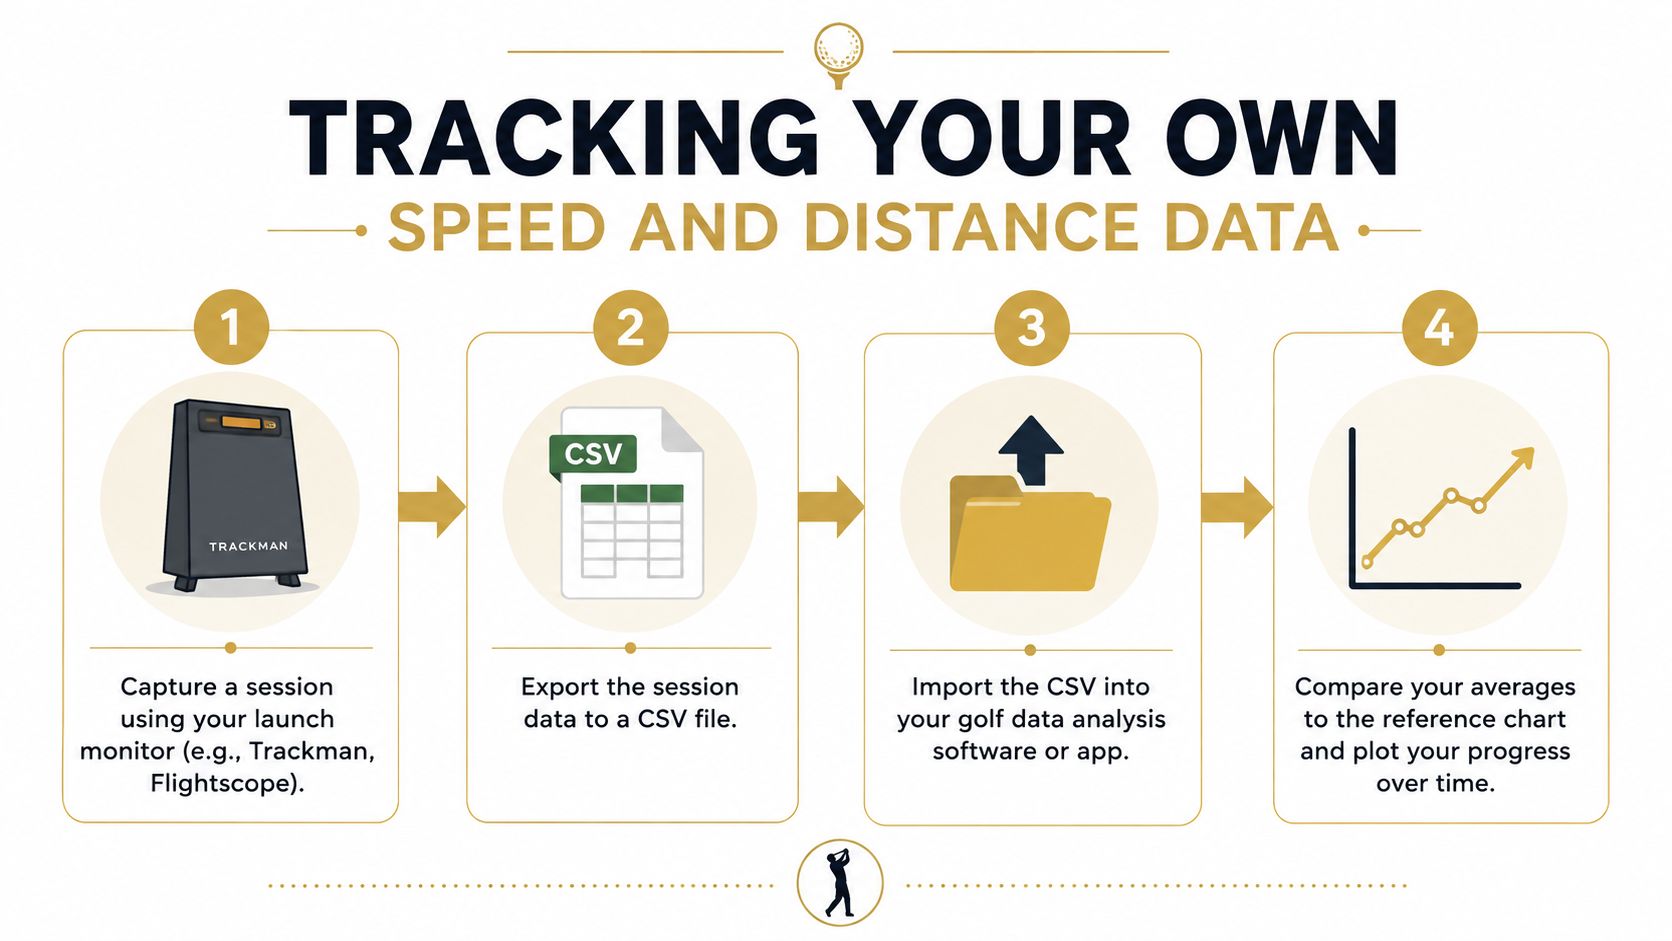
- Capture a consistent session. Use the same ball type, target, setup, and monitor placement. Warm up normally, then record controlled swings instead of chasing a personal best.
- Export the session. Save the monitor's CSV file with the date, club, setup, and conditions. Without that context, later comparisons can mislead.
- Import and normalize. A CSV workflow should recognize different device formats, align units, and flag incomplete or clearly abnormal shots. Check the compatibility information for CSV data workflows before combining files from different systems.
- Compare sessions by club and condition. Review median or typical carry, launch, spin, and dispersion. Separate centered strikes from mishits so one poor contact does not redefine the club's profile.
Dialed Golf supports a desktop-first launch-monitor workflow, with live pairing beginning with one compatible device and expanding, along with CSV and import workflows from several common data sources. The practical benefit is a connected record of launch-monitor practice data and the golfer profile used for bag and distance analysis.
Keep the raw CSV files, too. A launch-monitor data workflow reference can help clarify whether a session arrives through automatic account synchronization or manual upload. That distinction matters when files from different devices use different field names, units, or missing-value rules.
A short demonstration can help visualize the process:
For a practical setup at the range, review this launch monitor guide for driving-range practice. Choose the system that produces consistent records you can review by club, session, and playing condition. After several sessions, compare the personal carry window with the chart. Use the difference to test loft, shaft, ball, or delivery changes, then keep the option that improves spacing and predictability rather than the one that produces a single longest shot.
Modern Distance Cliffs and Future Benchmark Shifts
Distance does not rise evenly across every speed band. On the course, a small change in club speed can alter whether a golfer reaches a fairway bunker, carries a hazard, or holds a green with a longer approach.
An independent chart lists 93 mph at about 214 yards of total distance and 100 mph at roughly 280 yards total. Another industry benchmark places approximately 101 to 102 mph of club speed near a 250-yard carry and 110 to 111 mph near 300 yards of total distance. Those figures provide useful reference points, but they are not promises for an individual player.
The practical distance cliff appears when extra speed moves a golfer into a new course-management category. A player in the low 90s may face very different approach distances from one in the low 100s, even if the gap looks modest on a launch monitor. Strike quality, launch, spin, and course conditions still decide the actual result.
Equipment rules can shift future benchmarks as well. In a 2023 equipment-testing announcement, the USGA said the longest hitters could lose as much as 13 to 15 yards under revised 2028 ball-testing conditions, according to this USGA equipment-testing announcement. That projection shows why a chart needs a date and testing context.
Use the chart as a gapping and fitting baseline, then compare it with launch-monitor CSV records and a real-world carry window. Record the club, ball, monitor conditions, and test date. If a future session shifts, those details help separate equipment or testing changes from an actual swing regression.
How Coaches and Fitters Use Charts in Real Sessions
A coach or fitter rarely begins by telling a golfer to chase the distance shown beside a speed number. The session usually starts with a neutral baseline, then builds a diagnosis around the gap between expected and observed performance.
The first check is club speed and ball speed together. If speed is present but ball speed is low, the fitter examines strike location, face delivery, and contact efficiency. If ball speed is strong but carry is poor, launch and spin may explain the lost distance. If both are reasonable but dispersion is wide, a shorter or more controllable setup may be more useful than a faster one.
A practical session sequence
- Baseline: Record the golfer's normal swing with the current club and ball.
- Delivery: Review launch, spin, angle of attack, and strike location.
- Equipment test: Change loft, head, shaft profile, or ball in a controlled way.
- On-course translation: Convert the best repeatable carry window into a club-selection plan.
The chart gives the fitter a diagnostic frame. It can reveal that a golfer's distance problem isn't a lack of speed at all. A player may sit in the expected speed band but deliver the club inefficiently, or produce a strong strike with a launch condition that turns carry into excess height or spin.
The professional process also respects the player's intent. A golfer who wants maximum distance needs a different trade-off from one who prioritizes fairway control. The longest shot in the session is rarely the only result worth keeping. A repeatable window with predictable misses often has greater value on the course.
Validating Your Distance Data Against the Chart
A launch monitor can produce a convincing number from a poor shot. Before a golfer rebuilds a bag or changes a swing, the data needs a quality check.
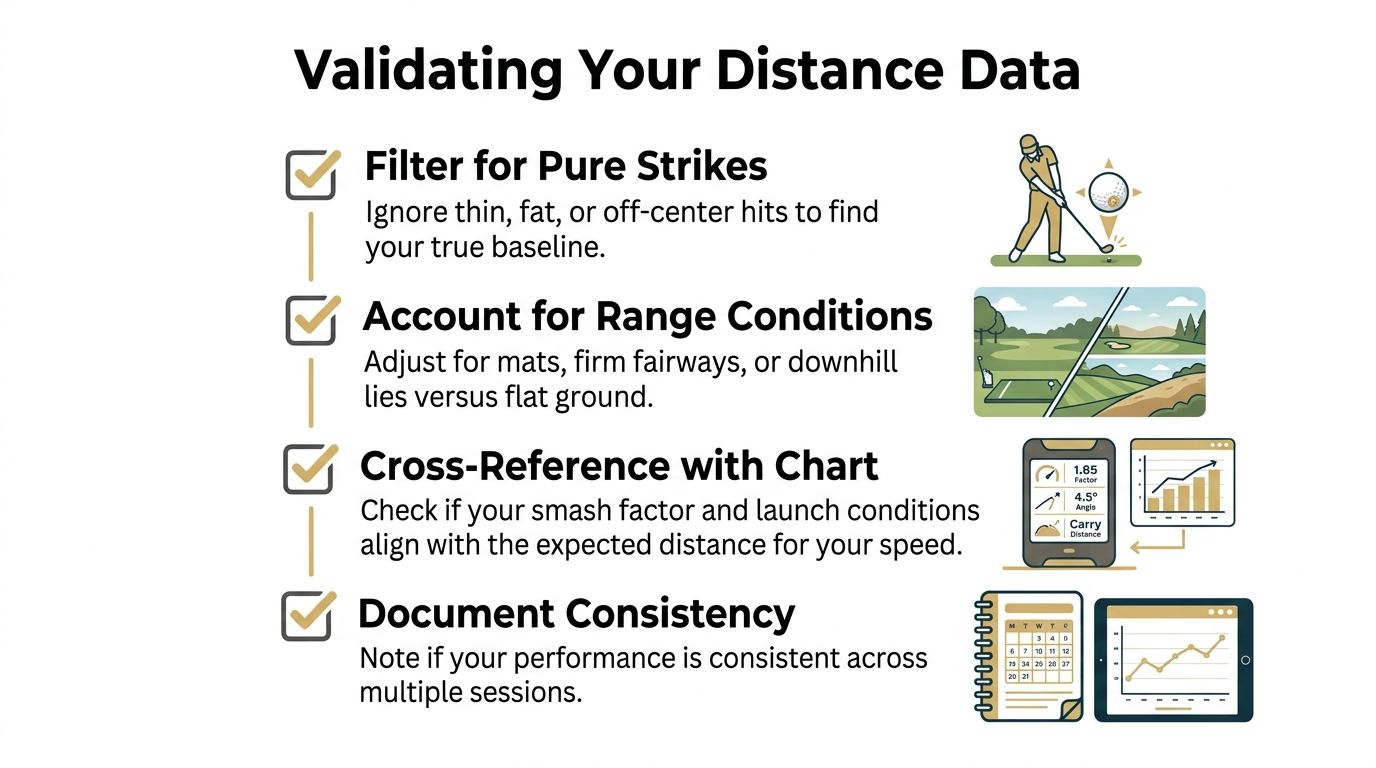
A validation checklist
- Filter for pure strikes. Remove thin, fat, heel, toe, and clearly mishit shots before establishing a baseline. A chart should be compared with representative contact, not the worst swing of the day.
- Record the conditions. Note whether the shots came from a mat, grass, indoor space, or outdoor range. Wind, temperature, altitude, slope, and turf can change the carry-to-roll relationship.
- Separate carry from total. Use carry for hazards and landing targets. Keep total distance as a separate field because rollout isn't stable across courses and sessions.
- Cross-reference the speed band. Compare club speed with ball speed, launch, spin, and strike. A mismatch between the speed band and carry usually points to an efficiency or delivery question.
- Document consistency. A personal chart should survive more than one practice session. Record the club, ball, monitor, setup, and date so later comparisons remain meaningful.
The golfer should also compare range data with course results carefully. A range ball, artificial surface, flat lie, or open landing area can make the session look different from a shot played toward a real target. That doesn't make the launch-monitor data useless. It means the golfer should maintain separate practice and on-course expectations.
The strongest personal benchmark is a carry window, not a single best shot. Once that window remains stable across sessions, it becomes useful for gapping and course management.
Next Steps for Deeper Data Analysis and Practice
The golf swing speed and distance chart works best as the first layer of a personal performance system. Start with the speed band, then build a club-by-club carry profile that includes ball speed, launch, spin, strike quality, and typical dispersion.
A practical routine has three parts:
- Capture: Record structured launch-monitor sessions instead of isolated swings.
- Compare: Review the personal carry window against the reference chart and identify the largest gap.
- Act: Use gap analysis to decide whether the next practice priority is speed, contact, launch, equipment, or course strategy.
Free web tools can remain the entry point for quick calculations and gapping checks. The consumer app serves as a pocket caddy on the course and is currently available through TestFlight rather than general App Store availability. Desktop practice is launch-monitor focused, with live pairing first and CSV import supporting a broader range of recorded data.
Golfers, coaches, and fitters should treat the chart as a working baseline that improves as the record improves. That approach produces better club decisions and more honest expectations than chasing a single distance number.
Dialed Golf connects launch-monitor practice, imported session data, bag gapping, and on-course decision support around one golfer record. Visit Dialed Golf to build a personal distance profile, review your speed-to-carry trends, and turn launch-monitor data into more confident practice and club-selection decisions.