

Most golf ball compression charts promise a clean answer: match a driver swing speed to a compression number, then buy the ball that sits in that row. That advice is useful only if the chart is treated as a starting hypothesis. Compression is a laboratory deformation measurement, not a universal cross-brand score, and no single number can predict distance, spin, feel, or scoring performance by itself.
A practical golf ball compression swing speed chart still has value. It narrows the testing field, gives a golfer a sensible first comparison, and creates a shared language for a launch-monitor session. The mistake is stopping at the label. Dialed Golf treats every chart row as a question the golfer must answer with repeated shots, not a rule the golfer has to obey.
Table of Contents
- Why Compression Charts Mislead Most Golfers
- What Compression Actually Measures at Impact
- The Swing Speed to Compression Reference Chart
- Why Two Balls With the Same Compression Can Behave Differently
- Measuring Your Own Swing Speed the Right Way
- Reading Launch Monitor Data to Test a Compression Choice
- Compression Bands Change by Club, Not Just by Swing
- A Practical Session Protocol to Validate Your Choice
- Building a Personal Ball Profile Over Time
- Quick Reference Card You Can Save or Print
Why Compression Charts Mislead Most Golfers
The familiar chart usually divides golfers into broad driver-speed bands, then assigns low, medium, or high compression to each group. The commonly used starting point places balls below roughly 70 compression with driver speeds under 85 mph, medium compression around 70 to 90 with speeds around 85 to 100 mph, and high compression at 90 or more above 100 mph. Those bands are useful as a filter, but they aren't a universal fitting law. Forgeway Golf's compression guidance also presents the ranges as guidelines rather than guarantees.
The deeper problem sits inside the word “compression.” Manufacturers use different measuring devices, and there's no industry-wide standard. Golf Digest reported that a ball labeled 70 by one brand may not be equivalent to a ball labeled 70 by another, while historical labels shifted as core chemistry and construction improved. Older tour balls marked 90 or 100 were reportedly closer to modern values of approximately 65 or 75, which makes old charts especially unreliable when readers compare them with current packaging. Golf Digest's explanation of compression measurement documents why the label can't carry that much authority.
The chart is a filter, not a verdict
A compression number can help identify candidates. It can't tell the golfer which construction will launch higher, which cover will produce usable wedge spin, or which ball will keep dispersion under control after an imperfect strike.
Practical rule: Use swing speed to choose the first balls to test. Use measured ball speed, launch, spin, carry, and dispersion to choose the ball to play.
Independent testing reinforces the caution. A 2025 test by Today's Golfer and Loughborough University measured deformation across 18 balls per model with an Instron 3365 machine and a defined force-based formula, showing that compression is a test result whose meaning depends on the method. The testing context is outlined by Fit My Golf Clubs.
That changes the buying question. Instead of asking, “Which compression matches the swing speed?” a better question is, “Which candidates behave best when the same golfer delivers the same club under the same conditions?” The rest of the fitting process should answer that question.
What Compression Actually Measures at Impact
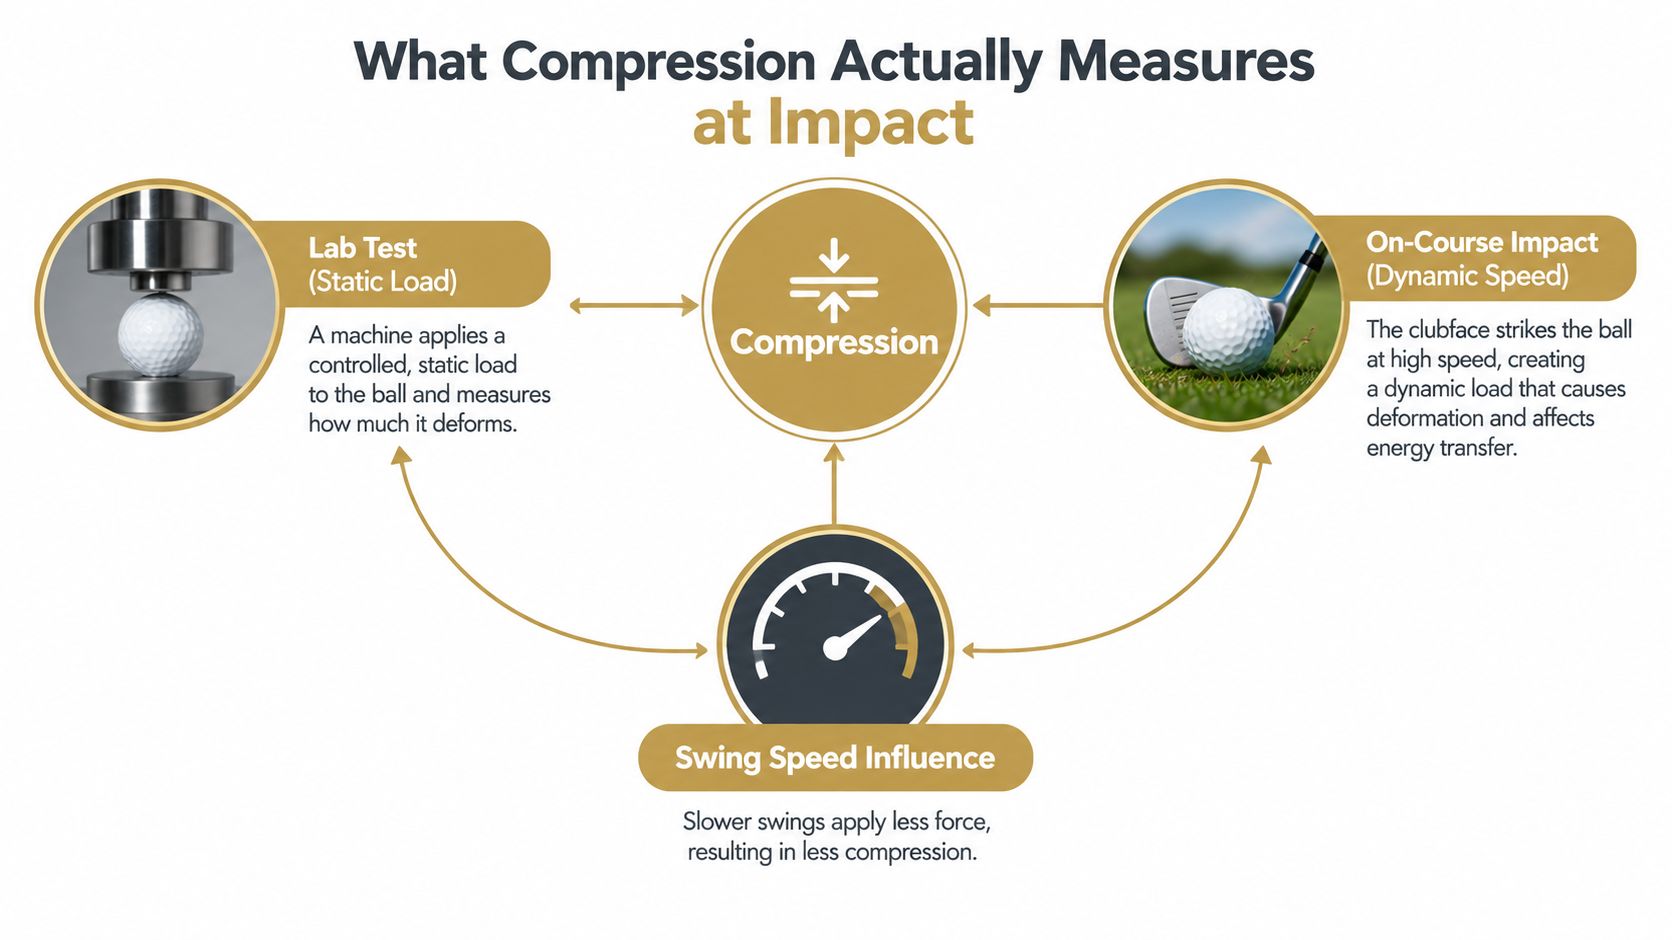
Compression describes how much a golf ball deforms under a defined load. A softer, low-compression ball deforms more easily, while a firmer, high-compression ball resists deformation. The test approximates impact by squeezing the ball, but a clubface strikes one side of the ball dynamically, so the laboratory procedure doesn't reproduce every detail of a real shot.
A slower swing supplies less impact force. A softer core can engage more readily, while a faster swing can load a firmer core without excessive deformation. That energy-transfer picture explains why speed belongs on a chart, but it doesn't prove that a softer ball is always longer for a slower player or that a firm ball is always better for a fast player.
Contact time is real, but it isn't a cutoff
Controlled impact research found that reducing compression by 20 units increased impact duration by approximately 44 microseconds. The same research found that contact time decreased as clubhead speed at impact increased, while lower-compression balls generally produced longer contact times than higher-compression balls. The experimental research on contact time and compression supports a mechanical relationship, not a universal swing-speed threshold.
Construction remains part of the impact equation. The cover, mantle layers, core geometry, temperature, strike quality, and club delivery all influence the resulting shot. Compression can affect feel and driver spin, but it doesn't independently determine the launch window or scoring-club performance.
The useful conclusion is modest and actionable: compression helps explain how a ball may respond to a delivered speed. It doesn't identify the best ball before the golfer measures the outcome. A fitter should use the number to form a testable expectation, then check whether ball speed, launch, spin, carry, and dispersion support it.
The Swing Speed to Compression Reference Chart
The chart below is a practical starting filter for driver testing. The bands are deliberately broad because compression readings vary by measurement method and because golfers with the same driver speed can deliver different attack angles, strike locations, and launch conditions.
| Driver swing speed | Starting compression band | What to watch on a launch monitor |
|---|---|---|
| Under roughly 85 mph | Under roughly 70 | Ball speed, launch, carry, feel, and driver spin |
| About 85 to 100 mph | About 70 to 90 | Ball speed and spin together, plus carry and dispersion |
| Above roughly 100 mph | 90 and up | Ball speed, launch window, spin stability, and strike tolerance |
A golfer under roughly 85 mph can begin with lower-compression candidates and prioritize launch, carry, and feel. That doesn't mean the softest available ball automatically wins. The launch monitor should reveal whether lower spin helps the ball stay playable or causes the shot to fall out of the air.
The middle band deserves the most careful comparison because it spans many constructions. A golfer around 85 to 100 mph might test a softer urethane model against a firmer multilayer model, then compare driver output with iron and wedge results. Ball speed and spin should be read together. A longer carry with an unstable launch or wider dispersion isn't an automatic improvement.
Above roughly 100 mph, firmer candidates are reasonable starting points, but strike quality can outweigh the compression label. A ball that produces slightly different speed on a centered strike may be less useful if its feel changes the golfer's delivery or if its short-game performance doesn't fit the player's priorities.
Confidence ranges beat false precision
A single compression number suggests certainty the measurement doesn't support. Independent readings can differ from manufacturer figures by several points, so a golfer should treat each band as a performance window, not a threshold.
For a deeper look at how ball speed relates to delivered speed, Dialed Golf readers can use this driver ball speed chart alongside the compression bands. The relevant comparison isn't label against label. It's the relationship between the golfer's delivered club speed, resulting ball speed, launch, spin, carry, and dispersion.
Why Two Balls With the Same Compression Can Behave Differently
Compression is one value inside a much larger construction file. Two balls can carry similar compression readings while using different covers, mantle layers, dimple patterns, and core geometries. Those design choices change how the ball responds across the bag.
A softer cover can alter short-game interaction. Layering can separate driver behavior from wedge behavior. Core geometry can influence how the ball responds as impact speed changes. That's why a compression label alone is a poor substitute for a controlled comparison.
Measurement method changes the meaning
The same nominal rating can represent different test conditions. Golf Digest's reporting on manufacturer devices shows why a cross-brand chart should avoid pretending that every number sits on one perfectly consistent scale. A more defensible comparison uses balls tested under the same method, then checks those readings against actual shot outcomes.
Independent robot testing also evaluates balls at slow, medium, and fast delivery speeds, rather than assuming one speed represents every golfer. That approach matters because performance rankings can shift with speed. A ball that feels efficient on a driver may not produce the preferred iron launch or wedge spin.
Read the specification as design intent
A golfer choosing candidates should ask what each ball appears designed to prioritize:
- Core response: Does the candidate belong near the softer or firmer end of the starting band?
- Cover behavior: Is the cover likely to support the player's wedge and greenside priorities?
- Layering: Does the construction suggest a deliberate separation between driver and scoring-club performance?
- Testability: Can the candidate be compared under the same club, strike, temperature, and launch-monitor setup as the alternatives?
The practical shortlist should contain two or three candidates, not one supposedly perfect compression. Label matching narrows the field. Shot data decides which construction earns a place in the bag.
Measuring Your Own Swing Speed the Right Way
A chart becomes unreliable when the input speed is unreliable. Golfers often remember a best swing rather than a representative delivery, or they use a range estimate that doesn't separate centered strikes from mishits. The useful number is a repeatable driver speed band supported by ball speed and strike-quality context.
A personal launch monitor can provide that foundation. Garmin R10 session exports are reported to include club speed, ball speed, launch angle, launch direction, spin rate, spin axis, backspin, sidespin, carry distance, total distance, club path, face angle, face-to-path, attack angle, smash factor, apex height, and spin-rate type. This overview of Garmin R10 exports and CSV workflows shows why the record should include more than club speed alone.
Build a credible baseline
Start with the same driver, ball position, tee height, and monitor placement used for normal practice. Warm up without recording the first swings as evidence, then capture a varied set of normal deliveries rather than chasing maximum speed.
Log these fields for each shot:
- Club speed and ball speed
- Launch angle and spin rate
- Carry distance and total distance
- Attack angle and smash factor
- Left-right outcome or dispersion
- Strike quality, if the setup can identify it
Don't discard every poor strike. A ball test based only on perfect contact describes an ideal golfer who may not exist on the course. At the same time, obvious mishits shouldn't dominate the result. Mark the strike quality so the golfer can compare centered shots separately from the broader playable pattern.
The same process should be repeated with an iron, because a driver-only speed band doesn't describe every relevant impact. Dialed Golf's guide to choosing a launch monitor for driving-range practice provides a useful equipment context for golfers building a repeatable testing setup.
Select the band from the pattern
Use the central tendency of normal driver swings, not the single fastest reading, to choose the starting compression band. Then retain the raw shot record. If a ball change later produces a different result, club speed and attack angle can show whether the golfer changed delivery instead of the ball changing performance.
Reading Launch Monitor Data to Test a Compression Choice
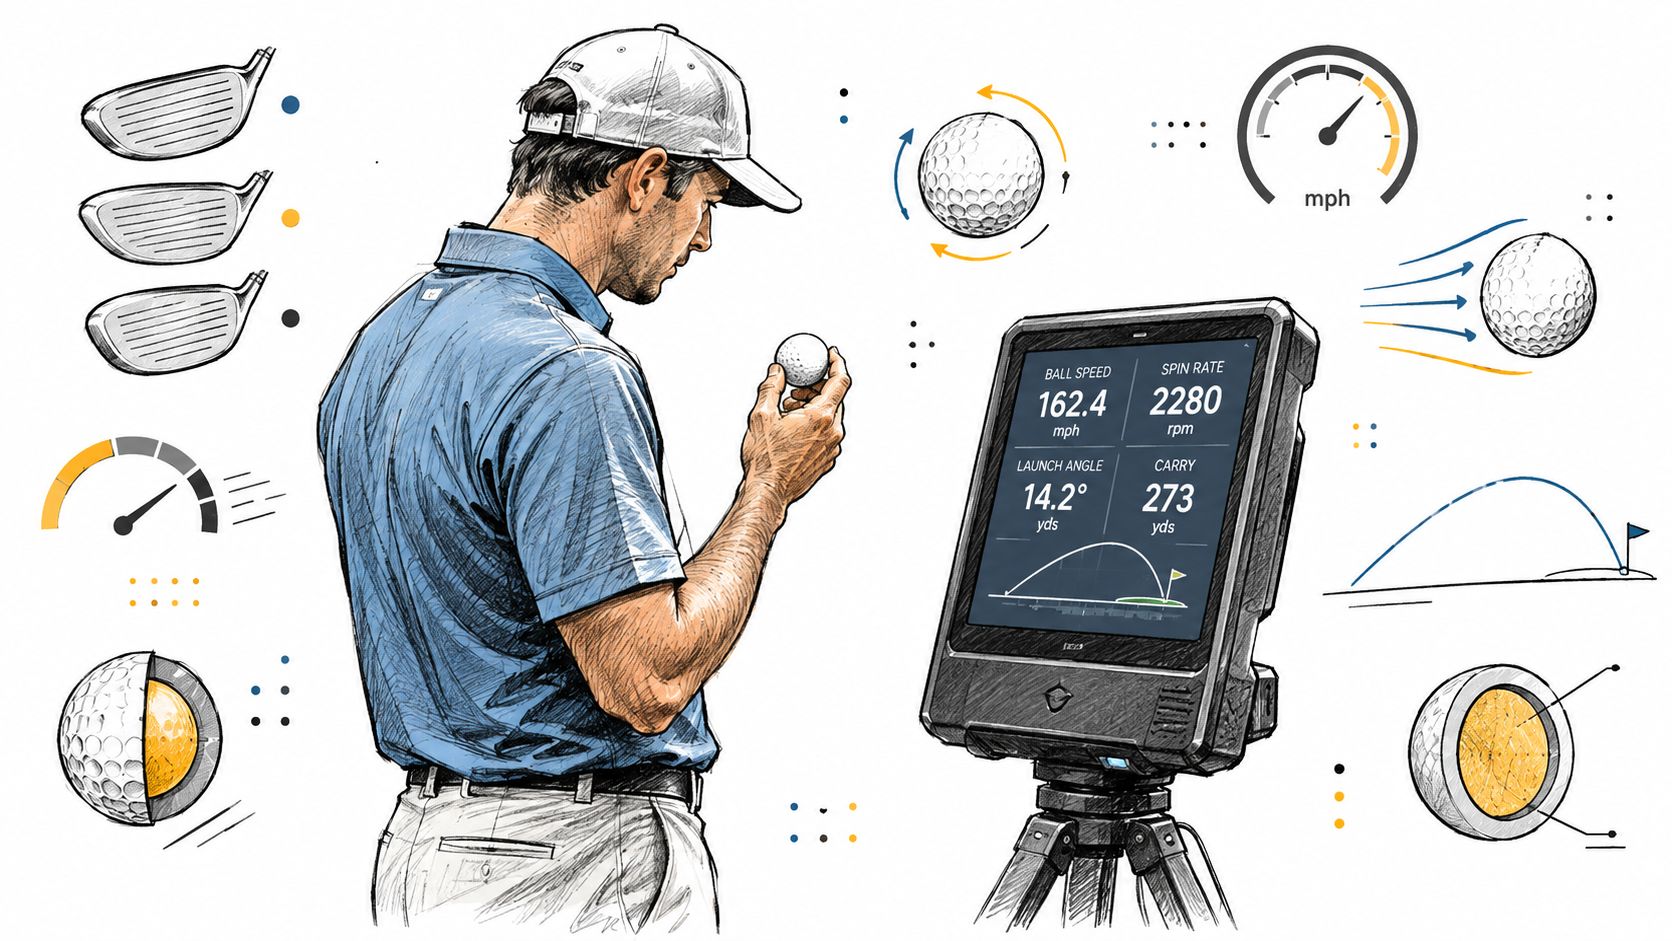
The launch monitor turns the chart from a buying shortcut into a testable claim. Club speed and attack angle describe the delivered motion. Ball speed, launch, spin, apex, carry, and dispersion describe what happened after impact.
That distinction matters because a golfer can swing differently with a new ball. A firmer feel may encourage a different strike, while a softer feel may change tempo or confidence. A fair comparison therefore records the delivery fields as well as the ball-result fields.
Read the outputs as a system
Ball speed without launch and spin is incomplete. Carry without dispersion can reward one unusually favorable strike. Spin without apex can hide a flight that doesn't hold the intended window.
A useful comparison asks:
- Did club speed and attack angle remain similar?
- Did ball speed change consistently, or only on one strike?
- Did launch and spin combine to produce the preferred carry?
- Did left-right dispersion remain playable?
- Did the ball preserve the desired response with scoring clubs?
The best result isn't necessarily the longest single shot. It's the candidate that produces a repeatable combination of speed, launch, spin, carry, and dispersion while fitting the golfer's feel and shot-making needs.
A launch-monitor session can be reviewed later rather than judged from memory. For golfers using a compatible practice setup, the following video offers another visual reference point before the data is compared across sessions.
Use averages and spread
Averages describe the center of the result. Dispersion describes how much the golfer must tolerate around that center. Both matter. A ball with a slightly lower average carry can be the better playing choice if the distance pattern and left-right spread are more predictable.
The monitor doesn't directly measure laboratory compression. It measures the outcome produced by the ball, club, strike, delivery, and environment. That makes the launch monitor a validation tool, not a replacement for understanding what the compression claim means.
Compression Bands Change by Club, Not Just by Swing
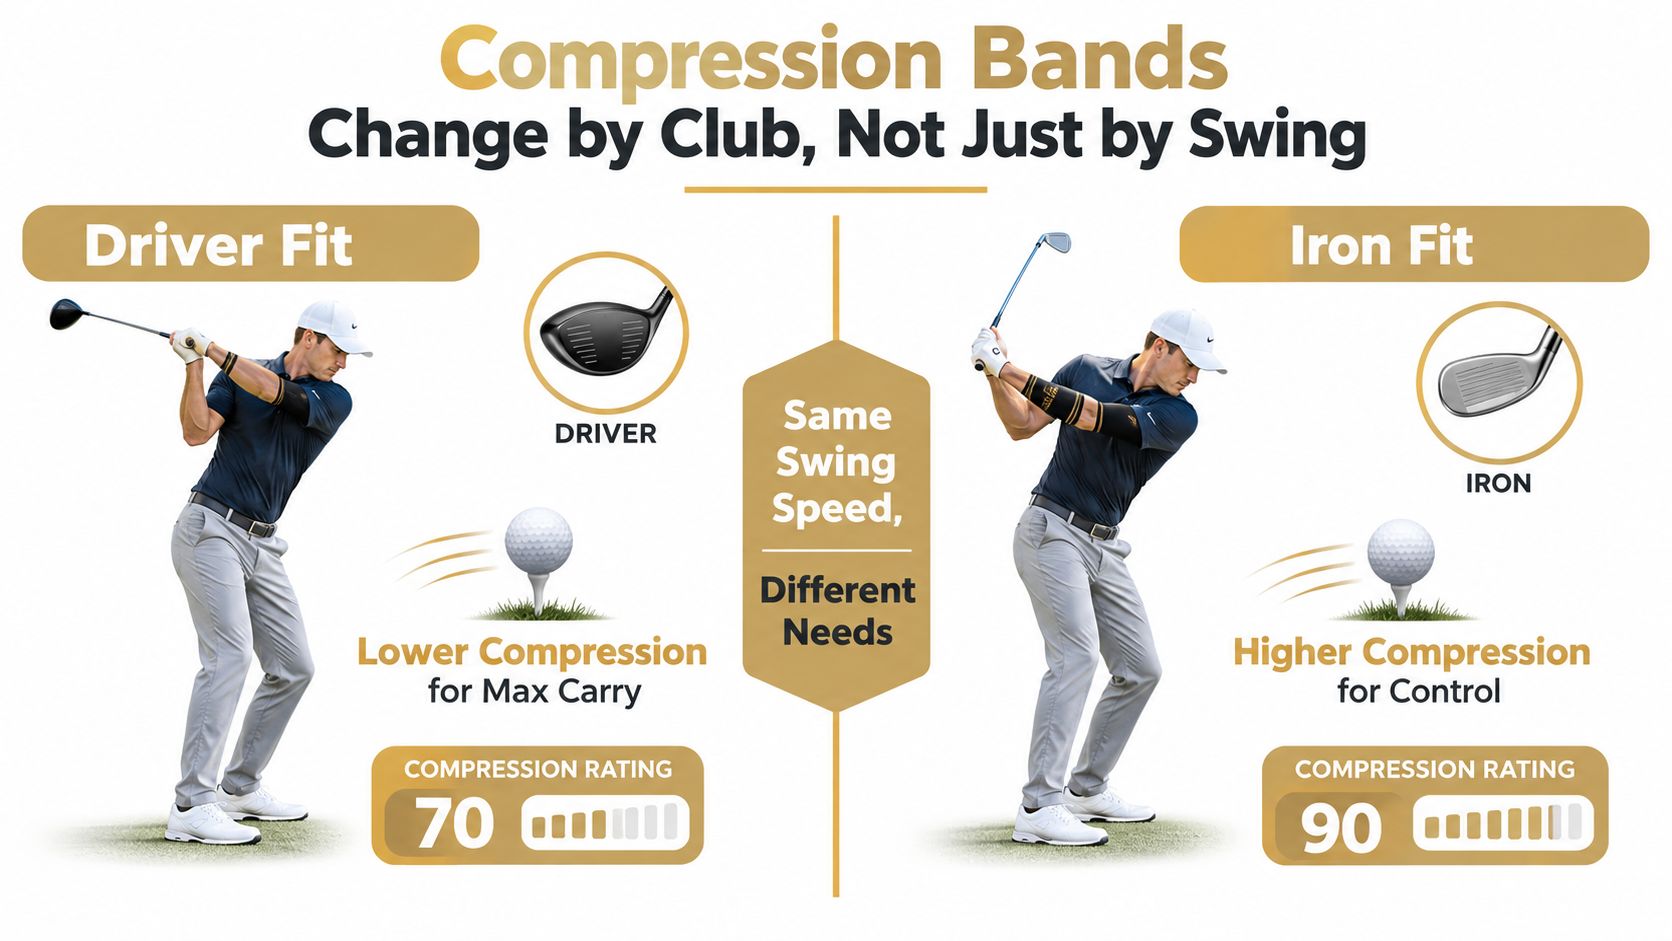
Driver speed is a convenient input because it's easy to measure and widely used. It's also an incomplete description of the shots a golfer needs to play. A ball selected for maximum driver carry may not produce the preferred iron launch, wedge spin, or partial-shot feel.
A driver impact emphasizes speed, launch, and spin management. An iron test adds stopping power and peak-height questions. A wedge test shifts the priority toward cover interaction, friction, and predictable distance control. The golfer may reasonably prefer one overall construction even when the ideal result differs by club.
Driver fit and iron fit answer different questions
For the driver, record ball speed, launch, spin, carry, and dispersion. For an iron, add peak height and landing behavior where the monitor supports them. For wedges, use controlled carry windows and spin response rather than treating a full-swing distance as the entire verdict.
Independent testing at slow, medium, and fast delivery speeds exposes why one speed-only answer is incomplete. A ball can fit the driver's speed band while producing a scoring-club result the golfer doesn't enjoy. The compression row remains a starting filter, but the club-specific test determines whether to stay inside it or override it.
Partial swings deserve their own evidence
A partial wedge isn't a slower driver. The intent, delivery, strike location, and face interaction change. A golfer whose main problem is holding greens shouldn't choose solely from driver speed if a different candidate provides more predictable wedge behavior and still produces acceptable tee-shot performance.
“The right ball is the one that survives the whole bag, not the one that wins a single launch-monitor column.”
A personal ball profile should therefore separate full driver shots, full iron shots, and scoring-club shots. The final choice can still be one ball, but the reasoning should reflect the shots that matter most to the golfer's score.
A Practical Session Protocol to Validate Your Choice
Theory becomes useful only when the test can be repeated. The golfer should select two or three candidate balls from the starting band, then compare them without changing the rest of the setup.
Use this sequence:
- Control the environment. Keep the same club, ball position, tee height, monitor placement, and launch-monitor settings. Record temperature because it affects the result.
- Label every shot. Mark the ball model before the shot so the record remains trustworthy after the session.
- Use normal swings. Avoid turning the first candidate into a speed session and the second into a fatigue session.
- Separate clubs. Test the driver, a representative iron, and a scoring club in distinct blocks rather than mixing every club together.
- Mark strike quality. Retain the full record, but analyze centered strikes separately from obvious mishits.
- Compare patterns. Review ball speed, launch, spin, carry, peak height, and left-right dispersion together.
The session should contain enough repeated shots to reveal a trend rather than a single lucky carry. The verified evidence supports repeated-shot analysis, but it doesn't establish one universal minimum sample size. The correct practical standard is stability: if removing one unusually hot or poor shot changes the conclusion, the test hasn't produced a dependable answer yet.
A fair comparison also requires fatigue control. If the golfer's club speed falls materially near the end, the record should show that. A ball that appears slower may just have received slower swings.
Building a Personal Ball Profile Over Time
Compression choice isn't permanent because the golfer's delivery, conditions, equipment, and priorities can change. The durable output isn't a single label. It's a personal ball profile that records what each candidate did with each important club.
The profile should include:
- Driver club speed, ball speed, launch, spin, carry, and dispersion
- Iron launch, spin, apex, carry, and landing behavior
- Wedge carry windows, spin response, and distance control
- Ball model and stated or measured compression claim
- Temperature and test conditions
- Strike-quality notes and any unusual delivery changes
A longitudinal record makes future testing more efficient. If a new ball produces lower ball speed but the golfer also delivered less club speed, the data points toward a swing change rather than a construction problem. If club speed remains stable while launch, spin, and dispersion shift repeatedly, the ball deserves closer attention.
Keep the record comparable
Use the same naming convention for every session and avoid mixing indoor and outdoor results without labeling the environment. A CSV workflow can preserve the underlying records for later comparisons. Dialed Golf supports CSV import for launch-monitor data, which fits a golfer's need to retain session history instead of relying on memory.
Re-test when the golfer changes a driver, alters a swing pattern, moves into markedly different conditions, or begins prioritizing a different scoring outcome. The chart remains useful because it supplies the initial search area. The profile improves because every later test either confirms or challenges the earlier choice.
Quick Reference Card You Can Save or Print
The chart is a starting point, not a command:
- Under roughly 85 mph: Begin below roughly 70 compression. Watch launch, ball speed, carry, feel, and driver spin.
- About 85 to 100 mph: Begin around 70 to 90 compression. Compare ball speed and spin together, then check carry and dispersion.
- Above roughly 100 mph: Explore 90 compression and up. Watch speed response, launch stability, spin, and strike tolerance.
Log the delivered motion and the ball result:
- Delivery: Club speed, attack angle, club path, face angle, and strike quality.
- Ball response: Ball speed, launch angle, spin rate, apex, carry, total distance, and dispersion.
- Testing context: Ball model, compression claim, club, temperature, monitor setup, and shot notes.
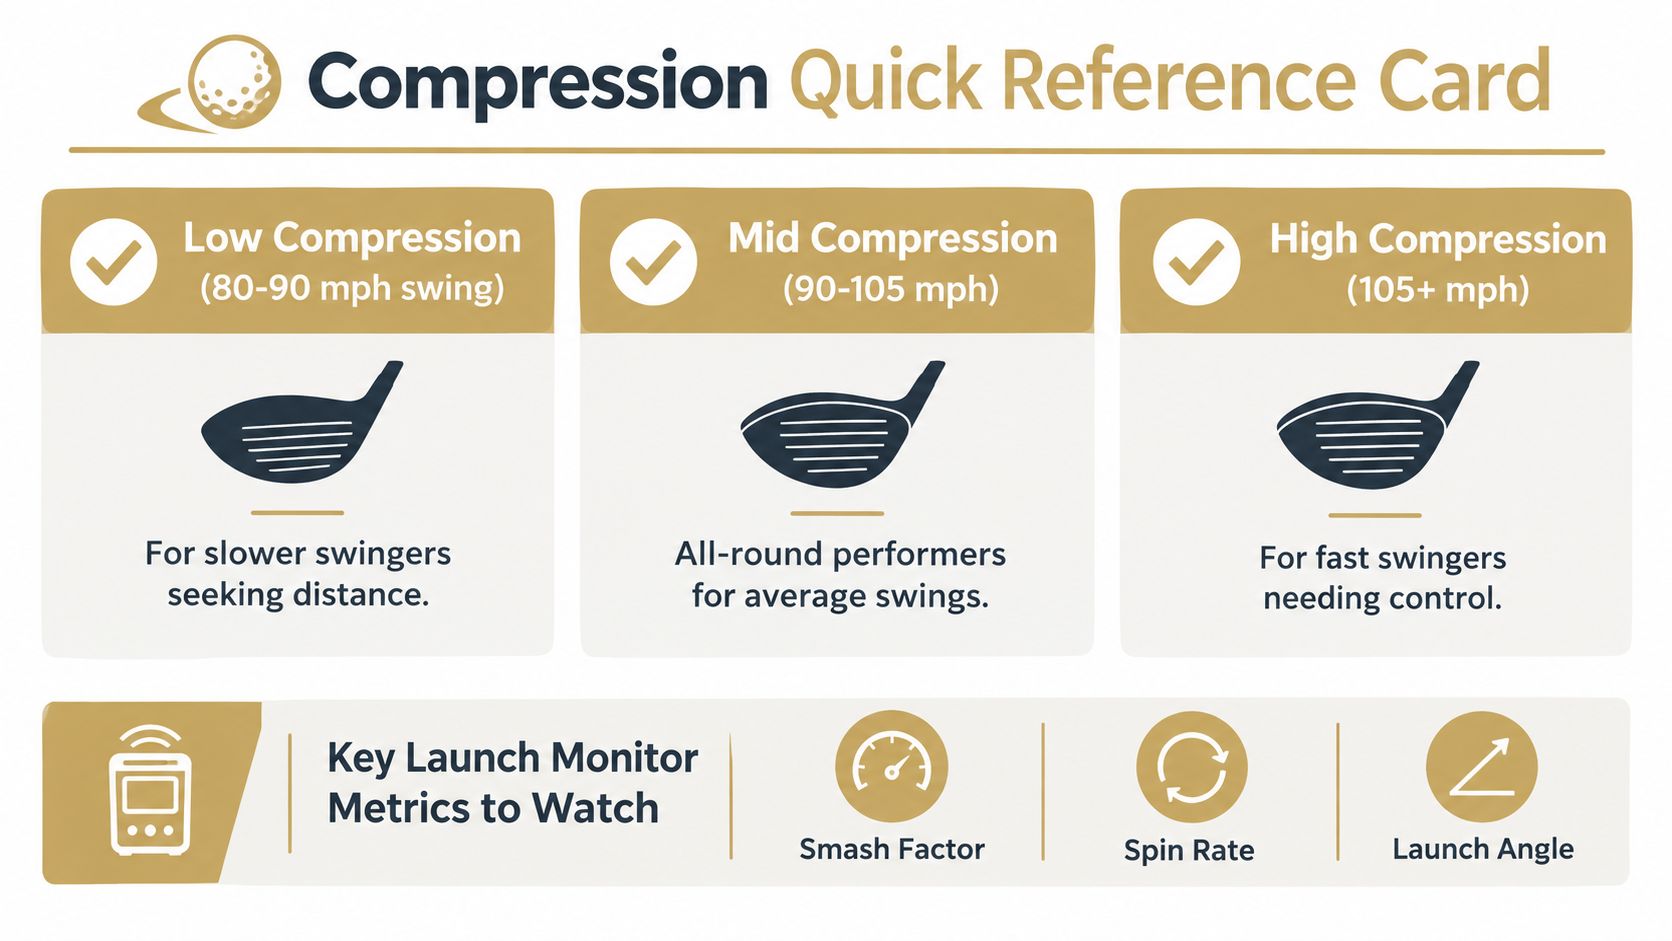
For a fair comparison, hold the club, ball position, strike conditions, temperature, and monitor setup constant. Test two or three candidates, use repeated normal swings, separate driver and scoring-club results, and judge averages alongside dispersion.
The two mistakes to avoid are simple. Don't choose from one carry number, and don't assume that matching compression labels means matching ball performance. The chart narrows the search. The golfer's own shot record makes the decision.
Dialed Golf turns launch-monitor sessions into a retained golfer record, with desktop-first live pairing for Garmin R10 and expanding device support, plus CSV and import workflows for practice data. Visit Dialed Golf to organize ball comparisons, connect course practice with launch-monitor evidence, and build a more useful personal profile than a compression label alone.