

Saturday morning starts with a familiar compromise. A 25-handicap golfer pulls the opening drive into the right rough, punches out, and makes bogey. The next green looks reachable, but a three-putt turns a decent approach into another dropped stroke. Then, on a par three, the same golfer flushes a 7-iron to 12 feet. The round contains doubles, recovery shots, a few clean swings, and enough solid contact to keep the next tee shot interesting.
That inconsistency is the shape of a 25 golf handicap. It isn't a verdict on athletic ability or a prediction that every round will land in the same scoring range. It's a portable measure of demonstrated ability, built from recent differentials and designed to help golfers of different levels play fairly. The useful question isn't only how to break 20. For a recreational golfer, the better question is which mistakes create the widest score swings, and which fixes reduce them without turning practice into a second job.
Table of Contents
- What a 25 Handicap Looks Like on the Course
- How a Handicap Index Is Actually Calculated
- Where a 25 Handicap Sits in the Global Picture
- Where a 25 Handicap Loses the Most Strokes
- Reading Your Launch Monitor Data at This Level
- A Practical 12-Week Practice Priority Plan
- Why Course Management Beats Swing Fixes at 25
- Common Questions and a Next-Session Checklist
What a 25 Handicap Looks Like on the Course
A single Saturday round can make the number feel confusing. The opening bogey may feel productive after a wayward drive, while the three-putt feels avoidable. A flushed iron creates the impression that a much lower score is close, but the next hole brings a penalty, a recovery shot, or a difficult chip from a poor lie. A 25 handicap often includes one or two satisfying swings per nine alongside a steady supply of shots that merely keep the hole alive.
On a moderate-slope course, a Course Handicap near 25 generally gives the golfer roughly that number of strokes against the course. Published benchmarks place a 25-handicap golfer around 98 to 100 strokes for 18 holes, or approximately 26 to 28 strokes over par on a par-72 course, although actual results vary because a Handicap Index measures potential rather than a fixed scoring average. Independent scoring benchmarks explain the difference between handicap and raw scoring average.
That range should be treated as context, not a promise. A golfer might post a score in the low 90s when tee shots stay in play and approach contact holds up, then produce a much higher number after penalties and recovery shots multiply. The handicap is influenced by the better differentials in the golfer's record, so ordinary rounds can sit above the index.
Index and Course Handicap are different numbers
A Handicap Index is portable. It reflects demonstrated ability across courses by accounting for factors such as Course Rating, Slope Rating, and playing conditions. The Course Handicap is the number used for the specific tees and course played that day, so it can differ from the index after the course adjustment.
Practical rule: Treat 25 as a scoring profile, not an identity. The goal is to make the bad holes less expensive while keeping the reliable shots available.
This is why a 25 handicap golfer shouldn't measure progress only by the best swing of the day. A single excellent 7-iron matters, but lowering the frequency of penalty strokes, topped approaches, and three-putts usually changes the scorecard more reliably. The profile is recreational and high-handicap, but it also offers clear opportunities because the largest leaks tend to be visible.
How a Handicap Index Is Actually Calculated
The World Handicap System turns posted scores into Score Differentials, then uses those differentials to calculate a Handicap Index. After a record reaches 20 scores, the system uses the best 8 differentials from the most recent 20, averages them, and applies the system's calculation rules. A golfer can establish an index with as few as three 18-hole scores, with the formula adapting while the record is still developing. The USGA outlines the calculation process for new and established records.
The differential is the building block
The underlying formula is:
Score Differential = (Adjusted Gross Score minus Course Rating, adjusted for playing conditions) × 113 ÷ Slope Rating
The final differential is rounded to the nearest tenth. A round's par alone doesn't determine its value because the system compares the score with the difficulty of the tees played. The Score Differential formula is defined by handicap authorities in this calculation guide.
For example, a score of 103 on a course with a 71.0 Course Rating and a 128 Slope Rating produces:
(113 ÷ 128) × (103 minus 71) = 28.2
That 28.2 is one differential, not automatically the golfer's Handicap Index. A record containing several lower differentials can produce an index below the golfer's typical gross score, because the system uses demonstrated potential rather than a plain average of every round.
Why the on-course number changes
The Course Handicap adjusts the index to the tees being played. The formula is:
Course Handicap = Handicap Index × (Slope Rating ÷ 113) + (Course Rating minus Par)
The result is rounded according to the handicap rules and used to determine the strokes received for that course and set of tees. A higher-slope course can produce a higher Course Handicap for the same golfer, while an easier set of tees can produce a lower one.
Playing conditions can also affect a posted score through the Playing Conditions Calculation. The adjustment can range from -1 to +3, depending on the system's assessment of conditions. The USGA's Handicap Index calculation explanation describes how recent differentials, course difficulty, and conditions work together.
Golfers who want a plain-language walkthrough can also use this guide to calculating a golf handicap, especially when checking why the index and Course Handicap don't match.
Where a 25 Handicap Sits in the Global Picture
A 25 handicap looks different depending on who serves as the comparison group. In the United States, the USGA reported average Handicap Index values of 14.2 for men and 28.7 for women in 2024. By 2025, 3.68 million golfers held a Handicap Index, and the U.S. total had grown more than 46% since 2020. The published U.S. comparison includes average values and handicap distribution data.
That places 25 well above the average U.S. male index, while it sits near the center of women's registered play. The distribution supports that distinction. The densest male handicap band was 13.0 to 13.9 at 5.42%, while the largest women's band was 27.0 to 27.9 at 4.07%, so a 25 handicap is much more common among higher-handicap women than among men.
| Population | Median Index | Where 25 Sits |
|---|---|---|
| U.S. men | 14.2 average | Clearly above the average |
| U.S. women | 28.7 average | Near the average |
| European men | 20.7 average | Above the average |
| European women | 30.4 average | Below the average |
European averages cited in the available data are 20.7 for men and 30.4 for women, which produces a similar pattern. The comparison shouldn't become a ranking exercise because national records differ in participation, posting habits, course access, and the types of golfers who maintain an official index. The USGA's handicap distribution reference also places the number in a broader standardized context, rather than treating a local club's average as universal.
Course setup changes the meaning
Tee selection, slope, and course layout matter. A golfer posting scores from forward tees on a relatively gentle course may carry a different index than the same golfer playing longer tees on a demanding links layout. That doesn't make either number misleading. It means the system is designed to translate performance relative to the course.
A 25 handicap is therefore neither an outlier nor a label that needs defending. It describes a common recreational scoring profile, especially among women, and a higher-than-average profile among men. For golfers interested in how speed relates to club selection, a driver ball speed chart can add useful context without replacing actual on-course dispersion data.
Where a 25 Handicap Loses the Most Strokes
The broad scoring problem usually isn't that every part of the game is equally weak. A published strokes-gained benchmark for a 25 handicap lists approximately -4.2 strokes off the tee, -9.0 on approach, -3.0 around the green, and -2.2 putting, for roughly -18.4 strokes versus scratch per round. The benchmark table breaks down the four scoring categories.
Approach play stands out immediately. In that dataset, it accounts for roughly half of the total strokes lost, which makes mid- and long-iron and wedge proximity a more practical priority than obsessing over putter technique. Tee-shot dispersion follows because a shot that misses into trouble often creates a second problem before the golfer even reaches the green.
| Category | Average strokes lost vs scratch | Share of total leakage | Typical root cause |
|---|---|---|---|
| Off the tee | -4.2 | Significant | Wide dispersion, penalties, poor contact |
| Approach | -9.0 | Largest share | Thin, heavy, or offline shots from scoring range |
| Around the green | -3.0 | Moderate | Difficult recovery lies created earlier |
| Putting | -2.2 | Smaller share | Long first putts and inconsistent speed |
The around-the-green figure can look alarming, but it doesn't mean every 25 handicap golfer needs an elaborate short-game rebuild. Many difficult chips and bunker shots are consequences of missed approaches and wayward tee shots. A golfer facing a 30-yard pitch from rough is often paying for an earlier miss, not revealing a completely independent chipping flaw.
The practical trade-off
A golfer who reduced even 30% of the approach-play loss in that benchmark would recover roughly 4 to 6 strokes, based on the cited -9.0 approach figure. That doesn't require perfect iron play. It can come from better club selection, more centered contact, fewer penalty-producing misses, and a reliable stock wedge distance.
The calculation is useful because it changes practice behavior. Spending an entire session chasing three-foot putts may improve confidence, but it won't address the largest measured leak if approach shots are finishing far from the target. Short game and putting still deserve maintenance, especially because they determine whether a missed green becomes a bogey or a double. They just shouldn't automatically receive the largest share of practice time.
Reading Your Launch Monitor Data at This Level
A launch monitor gives a 25-handicap golfer a way to replace vague feedback with a repeatable club profile. The useful information isn't every available metric. It starts with four readings that connect directly to scoring: carry distance, total distance, launch angle, and offline dispersion.
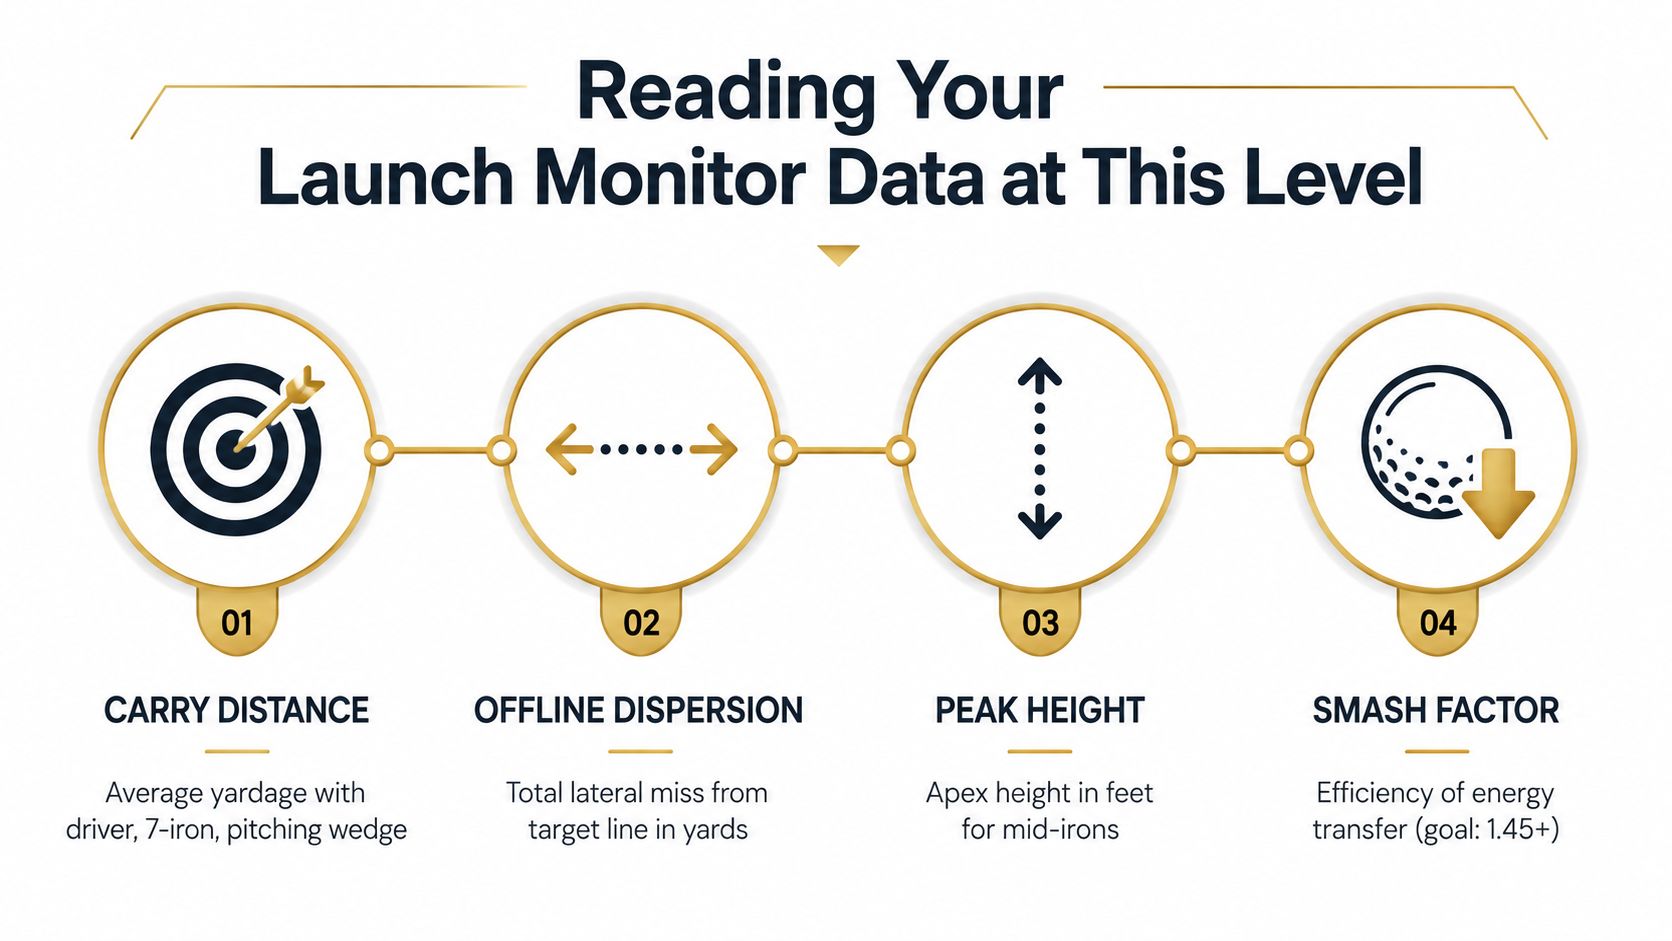
Carry tells the golfer where the ball lands, while total distance can be distorted by firm or soft ground. Launch angle helps explain whether a mid-iron is climbing enough to hold a green. Offline dispersion reveals the pattern that matters on the course, including whether the miss is consistently left, right, short, or scattered in both directions.
A typical session might reveal a 7-iron carrying 118 yards rather than a labeled 155, driver ball speed in the low 130s, and a wedge gapping pattern that collapses between the pitching wedge and gap wedge. Those examples are useful as diagnostic patterns, not universal benchmarks. The response should be practical: use more club when carry is short, prioritize strike over a wholesale swing rebuild, and establish reliable wedge windows instead of guessing from the club number.
Build a one-page club profile
A single session can expose enough information to make better decisions. With 60 shots, the golfer can record each club's carry, total distance, launch, and offline result, then remove obvious mishits from the primary carry estimate while keeping them visible in the dispersion picture.
- Carry distance: Record the distance the ball reaches in the air, not only the longest result.
- Total distance: Use it for rollout planning, but don't let it replace carry when choosing a club over hazards.
- Launch angle: Compare clubs within the set and look for a repeatable flight rather than one unusually high or low shot.
- Offline dispersion: Mark the full left-to-right pattern and identify the dominant miss before changing technique.
A club profile becomes especially useful when it guides on-course choices. If the 7-iron's average carry is shorter than expected, choosing a 6-iron or hybrid may be the correct scoring decision. If the driver pattern is wide, a controlled tee club or altered target line can save more than trying to add speed.
For golfers who want to organize distances and identify missing yardage windows, this gap analysis guide provides a practical structure. Dialed Golf's desktop workflow is designed for launch-monitor practice, with live pairing beginning on desktop and data imports available from several supported file formats and systems.
A Practical 12-Week Practice Priority Plan
A 25-handicap golfer doesn't need every practice session to feel different. The plan should make the highest-cost misses visible, then apply pressure gradually so range performance transfers to the course.
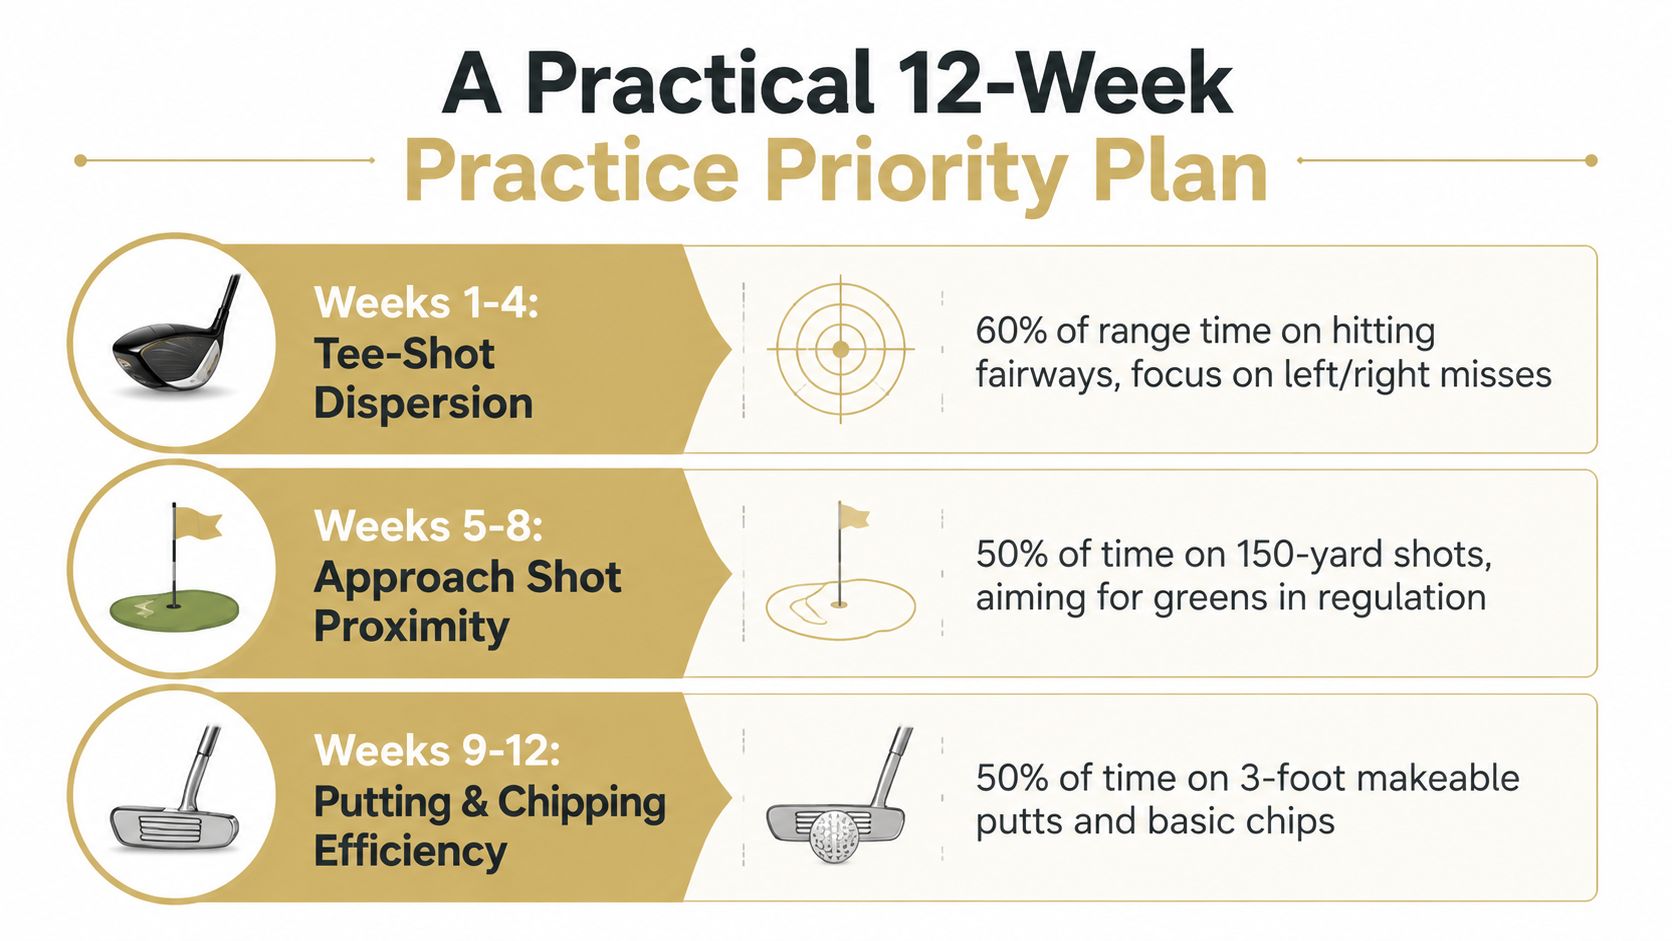
Weeks 1 through 4 target dispersion
Dedicate 60% of range time to driver and tee-shot control. The target isn't a perfect swing. It's a fairway-width corridor and a simple record of how many of 10 attempts finish inside it.
A repeatable session can use:
- Warm-up: 10 relaxed shots with a wedge and short iron.
- Focused block: 30 driver shots aimed at a fairway corridor, recording left, fairway, or right.
- Random simulation: 15 tee shots with changing targets and clubs, as if playing different holes.
- Cool-down: 5 controlled swings with the club that produced the most reliable pattern.
The measurable target is a wider usable fairway pattern and fewer recovery situations, not a new personal distance record.
Weeks 5 through 8 move inside 150 yards
Shift the main block to approach shots, using launch-monitor data to establish consistent 20-yard yardage windows and a stock distance for every wedge. A 60-shot session can include 10 warm-up shots, 30 approach shots from different lies, 15 random targets, and 5 calm finishers.
Record whether each ball finishes short, long, left, right, or on the green. The target is more greens hit from the 125-to-150-yard range, supported by a club choice that favors predictable carry.
Weeks 9 through 12 maintain the scoring end
Reserve approximately 25% of practice time for short game and lag putting. The rest should continue to reinforce tee shots and approaches so the golfer doesn't abandon the largest leaks as soon as putting becomes more comfortable.
Use a maintenance session with 10 chips, 20 lag putts, 20 approach shots, and 10 tee shots. The target is a reduced three-putt count, cleaner basic recoveries, and continued approach practice under changing targets.
The 12-week practice video can add a visual reference to the routine. The plan works when every session ends with a number the golfer can compare, not just a feeling that the swing was better.
Why Course Management Beats Swing Fixes at 25
A golfer can lose more strokes by choosing the wrong target than by making a technically imperfect swing. Consider two versions of the same round. In the first, the golfer hits driver on every par four, aims at tucked pins, and attempts hero recoveries from trees. In the second, the golfer chooses the wider side of the fairway, aims for the center of the green, and lays up when the next shot offers a poor risk-to-reward trade.
The second round may contain the same swing flaws. It can still produce a push, a thin approach, and a missed short putt. Yet the misses are less likely to become penalties or difficult recovery shots. That difference matters because available benchmark data identifies tee shots and approach play as the largest broad categories of lost strokes for a 25 handicap.
The exact penalty total varies by player and course, so it shouldn't be treated as a universal fixed figure. The decision rules below are more useful than a made-up average:
- Favor the wider side: Aim away from the trouble that turns a normal miss into a penalty.
- Clear trouble comfortably: Choose the longest club that clears the hazard with room for an ordinary strike, not a perfect one.
- Lay up from poor lies: Treat a shot over 50 yards from a tight lie as a lay-up when the alternative brings a high-risk miss into play.
- Protect the hole: Assume a hole is headed toward par or worse unless a birdie opportunity is available.
- Plan the next shot: Select a lay-up yardage that leaves a full, comfortable swing rather than an awkward partial shot.
| Stroke source | Typical strokes lost / round | Fix difficulty |
|---|---|---|
| Poor decisions and penalty exposure | Varies materially by player | Low to moderate |
| Tee-shot dispersion | -4.2 versus scratch in the benchmark | Moderate |
| Approach inconsistency | -9.0 versus scratch in the benchmark | Moderate to high |
| Short-game recovery | -3.0 versus scratch in the benchmark | Moderate |
| Putting | -2.2 versus scratch in the benchmark | Moderate |
The table's benchmark figures come from the published strokes-gained breakdown already cited above. A course-management adjustment can start immediately, while a swing change may take longer to stabilize. Swing work still matters, especially for approach contact and driver dispersion, but it pays more when smarter targets stop turning manageable misses into scorecard disasters.
Common Questions and a Next-Session Checklist
Does one 92 make a 25 handicap a fluke?
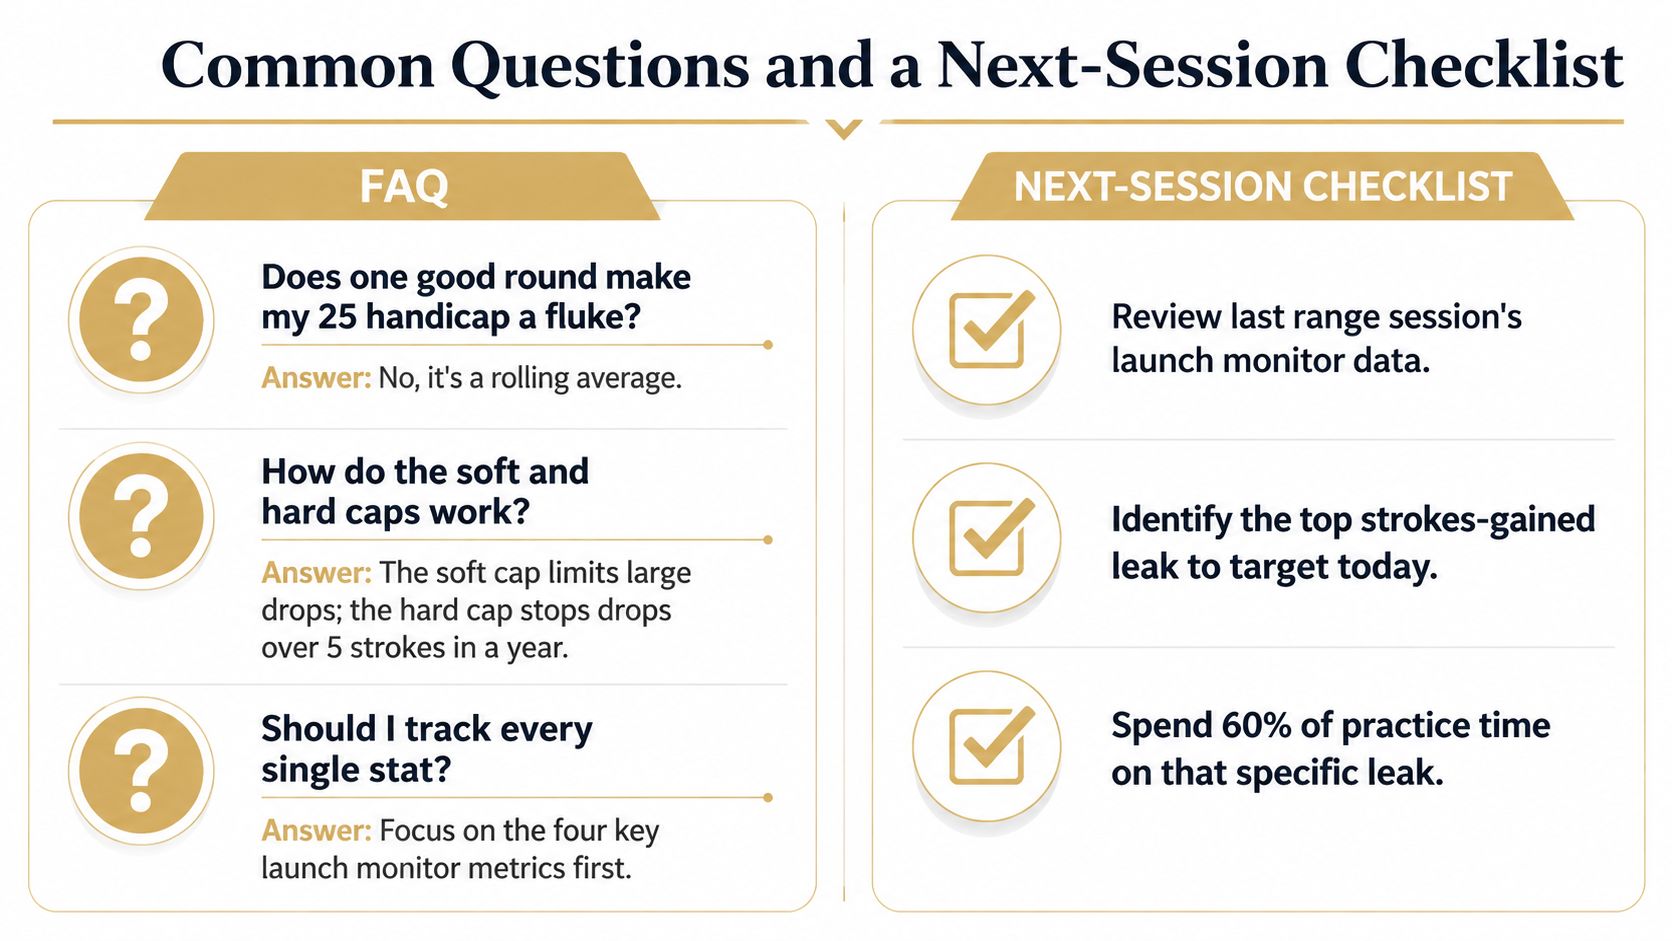
No. One good round doesn't erase the index, because the World Handicap System evaluates a rolling record of differentials and, once the record contains 20 scores, uses the best 8 from the most recent 20. A low score can improve the index if its differential is strong enough, but the number still reflects the broader record rather than one afternoon.
The system also includes safeguards. An exceptional score can trigger a reduction when it is 7.0 strokes or better than the golfer's Handicap Index at the time, while the soft-cap and hard-cap process limits an index from rising too far above the golfer's Low Handicap Index from the prior 365 days. Rule 5 explains exceptional scores and cap protections.
How long does it take to move from 25 to 18?
A drop of seven index points is a meaningful project, not a guaranteed short sprint. For a recreational golfer practicing consistently and posting rounds, a realistic planning horizon is roughly two seasons, with the actual timeline affected by practice quality, playing frequency, health, course difficulty, and whether the golfer addresses the largest scoring leaks.
Lessons and launch-monitor sessions solve different problems. A qualified lesson can identify a motion or contact issue that data alone can't explain. A launch monitor can reveal whether the change improved carry, launch, and dispersion. The strongest combination is targeted instruction followed by measured practice, rather than buying more equipment or chasing isolated swing positions.
What should happen in the next session?
Use this checklist:
- Warm up: Hit 10 chipping shots from inside 30 yards.
- Test approaches: Hit 20 shots toward a 150-yard flag from three different lies.
- Record gapping: Capture carry and dispersion for woods and irons.
- Simulate the course: Play nine holes using conservative targets.
- Review the plan: Compare the scorecard with the pre-round goals, especially penalties, recovery shots, and three-putts.
A 25 golf handicap becomes easier to improve when every round supplies useful evidence. Post every acceptable round so the Handicap Index reflects the progress, and use the next practice session to target the largest measured leak rather than the most frustrating shot.
Dialed Golf connects a pocket caddy for on-course decisions with desktop launch-monitor practice and a single golfer record, so a 25-handicap player can carry course-management goals into measured range work. Visit Dialed Golf to use the free web tools, explore the consumer app, and review the Pro plan across the app and desktop.