

A scratch golfer hits roughly 52% of greens in regulation, while a 20-handicap golfer is closer to 16% to 19%. The useful question isn't whether either figure sounds good, it's where a golfer sits on that curve and which practice decisions can move the number.
That gap changes the meaning of a round. The difference between a player who creates frequent putting opportunities and one who relies on recovery shots isn't just “better contact.” It's a measurable difference in how often approach play reaches the putting surface within the hole's regulation allowance.
The benchmark isn't perfect. Independent datasets disagree on several handicap points, partly because their player pools and collection methods differ. They do agree on the direction and the steepness of the curve. GIR falls materially as handicap rises, making it one of the clearest scorecard metrics for locating current skill and choosing what to practice next.
Table of Contents
- What Greens in Regulation Actually Measures
- Benchmark GIR Percentages Across Handicap Groups
- Translating GIR Rate Into Greens Per Round and Scoring
- Capturing GIR Data On-Course and From Launch Monitors
- Live Pairing Versus CSV Import for Practice Sessions
- Why Approach-Shot Dispersion Is the Highest-Leverage Practice
- Short-Game Work That Protects the Greens You Miss
- Putting GIR to Work in a Defensible Practice Plan
What Greens in Regulation Actually Measures
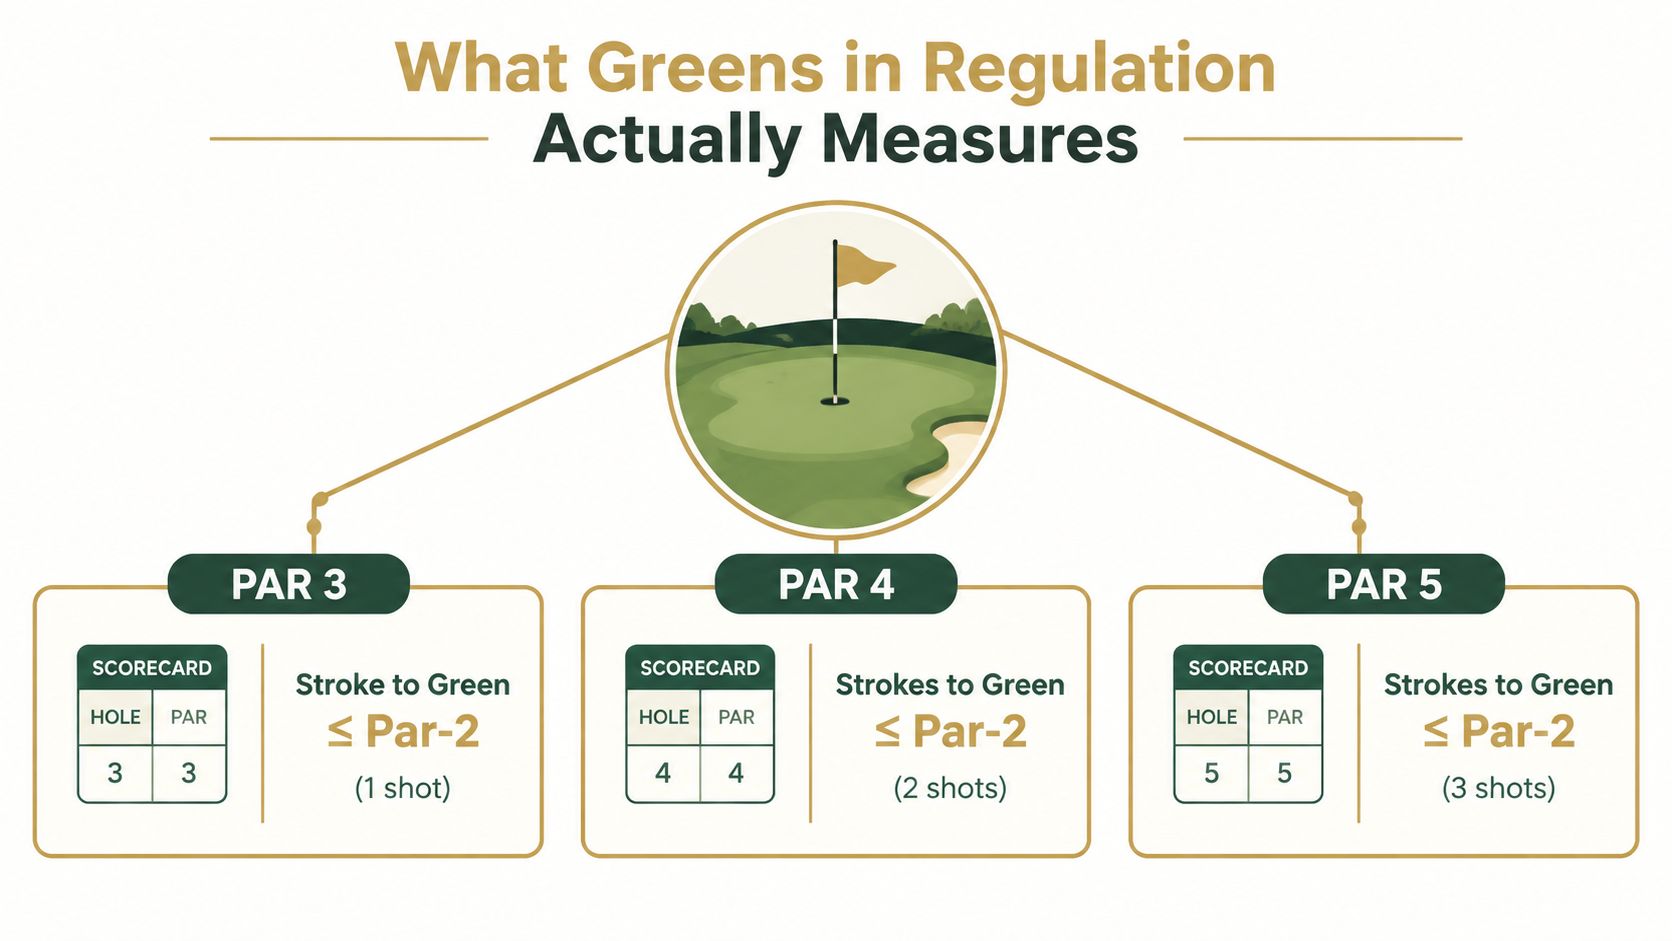
Greens in regulation, or GIR, records whether the ball reaches the putting surface in two strokes fewer than par. A par 3 counts when the tee shot finishes on the green, a par 4 counts when the ball is on the green by the second shot, and a par 5 counts when it arrives by the third shot. The formal definition is explained in this breakdown of the GIR rule.
The ball must finish on the putting surface itself. A shot on the fringe or apron doesn't count, even if the next stroke is effectively a putt. A ball that finishes pin-high in the rough also misses the GIR definition, because proximity alone isn't the measure.
Why the boundary matters
GIR separates approach opportunity creation from what happens after the ball reaches the green. Fairways hit can describe tee-shot position, but they don't tell whether the next shot reached the target. Total putts describe conversion after arrival, but they don't reveal how often the golfer created a legitimate putting chance.
That separation makes GIR useful. A player can hit a green and three-putt, or miss a green and save par. GIR doesn't claim to explain the whole hole. It identifies whether tee-shot and approach performance delivered the ball to the putting surface in time.
The par-based edge cases
A reachable par 5 may produce an eagle putt after a drive and a second shot. That still counts as one GIR because the ball reached the green in three strokes or fewer. A par 3 that finishes on the green with one tee shot also counts, even if the putt is long.
The metric is therefore simple enough to apply consistently across ordinary scorecards. The definition's strict putting-surface requirement is what keeps benchmarks interpretable across different courses and player populations. GIR is not a vague label for solid contact. It's the cleanest standard-scorecard proxy for approach performance.
Benchmark GIR Percentages Across Handicap Groups
The benchmark range is more useful than one supposedly universal target. Two independent handicap-based datasets show the same downward pattern, but their values diverge enough that the source and sample must remain visible.
| Handicap Band | Arccos GIR % | Aggregated Study GIR % | Sample Notes |
|---|---|---|---|
| Scratch or 0 | 52% | 62% | Independent handicap-based datasets, with different player pools and collection methods |
| 5 | 37% | 46% | Both show a clear drop from scratch-level play |
| 10 | 32% | 35% | The datasets are relatively close at this band |
| 15 | 23% | 23% | Exact agreement in the cited distributions |
| 20 | 19% | 16% | Both place this group well below the mid-handicap range |
| 25 | 15% | 9% | The largest visible separation appears at the higher-handicap end |
Golf Monthly's benchmark summary reports about 52% GIR for scratch golfers, 37% for 5-handicaps, 32% for 10-handicaps, 23% for 15-handicaps, 19% for 20-handicaps, and 15% for 25-handicaps. Shot Scope's handicap breakdown gives a separate distribution: 62% for 0-handicap players, 46% for 5-handicaps, 35% for 10-handicaps, 23% for 15-handicaps, 16% for 20-handicaps, and 9% for 25-handicaps.
What the disagreement means
The gap does not make the benchmarks useless. It limits how precisely they should be treated. Player selection, course setup, handicap definitions, collection methods, and the period represented can all shift the observed GIR rate.
The shared direction carries more practical weight than any isolated value. Both datasets show GIR falling from low-handicap to high-handicap play, with a clear separation across the 10-, 15-, 20-, and 25-handicap groups. A further handicap-based GIR reference reports another distribution, including about 59% at 0 handicap, 41% at 5, 21% at 15, 14% at 20, and 9% at 25.
Use these figures as a benchmark band, then test them against your own rounds and launch-monitor approach data. The benchmark supplies a number to chase. Shot patterns explain which practice change might move that number.
Practical rule: Use the table to locate a performance band, not to argue over whether a 20-handicap “should” be at 16% or 19%.
A 20-handicap comparing directly with scratch-level GIR has chosen a distant reference. Tracking progress toward the 15-handicap band creates a nearer, measurable target for approach practice and short-game planning.
Translating GIR Rate Into Greens Per Round and Scoring
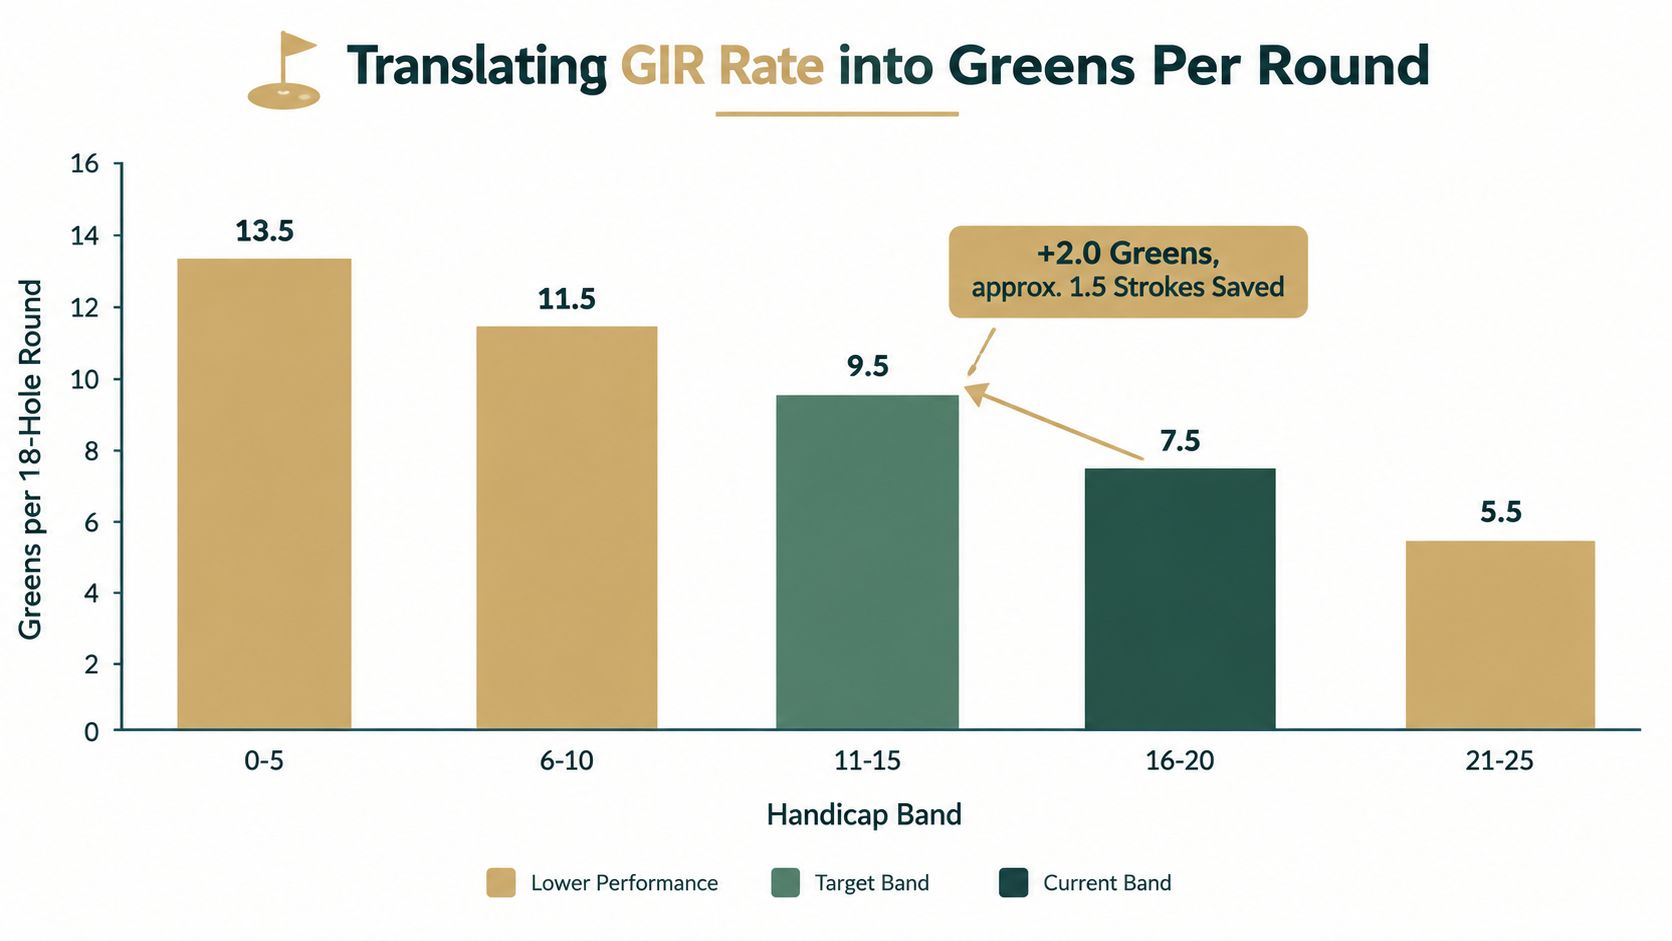
A GIR percentage becomes more useful when converted into greens per round. Multiply the rate by the holes played. Over 18 holes, 52% produces about 9.36 greens, 32% about 5.76, 23% about 4.14, and 15% about 2.7, based on the benchmark calculations reported earlier.
That conversion shows why handicap bands can feel far apart on the course. The difference between scratch and a 25-handicap in that benchmark exceeds 6.5 greens per round. The scoring consequence is repeated: the higher-handicap player begins more holes from beside the green, rather than from the putting surface.
The arithmetic behind a target
Moving from 20% to 30% GIR adds 10 percentage points. Across 18 holes, that equals 1.8 more greens per round, which golfers commonly describe as roughly two additional greens.
The cited data also provides a useful comparison between 10- and 15-handicap golfers. Shot Scope reports that a 10-handicap averages 6.3 greens per round, while a 15-handicap averages 4.14. That works out to approximately one GIR every three holes for the 10-handicap and one every four holes for the 15-handicap.
An added green does not automatically save a stroke. Its value depends on the approach location, first-putt difficulty, putting performance, penalty avoidance, and the quality of the short game after missed greens. The practical gain is another chance to avoid a recovery shot and start the hole's scoring work with a putter.
Why the scoring connection needs care
GIR is a scoring lever, not a direct strokes-saved calculator. A golfer can raise GIR while leaving long first putts and see limited immediate scoring improvement. That result does not make the metric irrelevant. It identifies whether approach performance is improving, then directs attention to the next constraint.
“Hit it better” is difficult to audit. “Move from four greens toward six” creates a countable target. Record the greens, then examine whether the increase came from better carry control, tighter start lines, or more disciplined targets. Pair the round total with approach-location notes, so a higher GIR reflects repeatable shots rather than a short run of favorable outcomes.
Capturing GIR Data On-Course and From Launch Monitors
A mid-handicap golfer can build a reliable GIR record without complicated equipment. The first workflow happens during a normal round, using a consistent definition and a simple mark beside each hole.
On-course marking
Before play, the golfer decides that only a ball finishing on the putting surface counts. During the round, a circle beside the hole number records a GIR, while a short note records the approach club, approximate distance, miss direction, and putts. Afterward, the record can be transcribed into a spreadsheet with fields for date, course, handicap index, fairways hit, GIR, and putts per GIR.
This method captures the result that matters on the course. It also preserves context that a launch monitor may not provide, such as wind, lie, turf, elevation, and decision quality.
Launch-monitor capture
A second workflow uses simulated rounds or practice holes. Systems that support launch-monitor exports can provide shot-level data from devices and software environments, including Garmin, Rapsodo, SkyTrak, FlightScope, Uneekor, GSPro, Awesome Golf, and other compatible sources. A public launch-monitor compatibility reference lists supported ecosystems and devices, including Garmin R10, SkyTrak, FlightScope Mevo and Mevo+, and Rapsodo MLM and MLM2PRO.
The golfer exports a CSV, identifies the hole and par, then applies the same rule used on the scorecard. Distance to pin alone isn't enough. The calculation needs to determine whether the ball finished on the putting surface within par minus two strokes.
| Device | Software | Key Export Columns | GIR Calculation Note |
|---|---|---|---|
| Garmin R10 | Simulator or device software | Hole, club, carry, distance to pin, shot result | Confirm the final shot count and whether the simulated ball finished on the green |
| Rapsodo | Device software or simulator | Club, carry, start direction, distance, hole result | Use the hole result alongside shot data, not proximity alone |
| SkyTrak | Simulator software | Club, carry, total, pin distance, lie or result | Apply the par-based stroke threshold |
| FlightScope | Simulator or analysis software | Club, carry, launch, landing, pin distance | Check the final landing location against the green boundary |
| Uneekor | Simulator software | Club, carry, landing, pin distance, shot sequence | Preserve hole and shot order before calculating GIR |
For a practical overview of the desktop workflow, the launch-monitor app guide provides the relevant context. The key is a shared schema. If on-course and simulated sessions use the same fields, the golfer can compare sessions without confusing a device change with a performance change.
Live Pairing Versus CSV Import for Practice Sessions
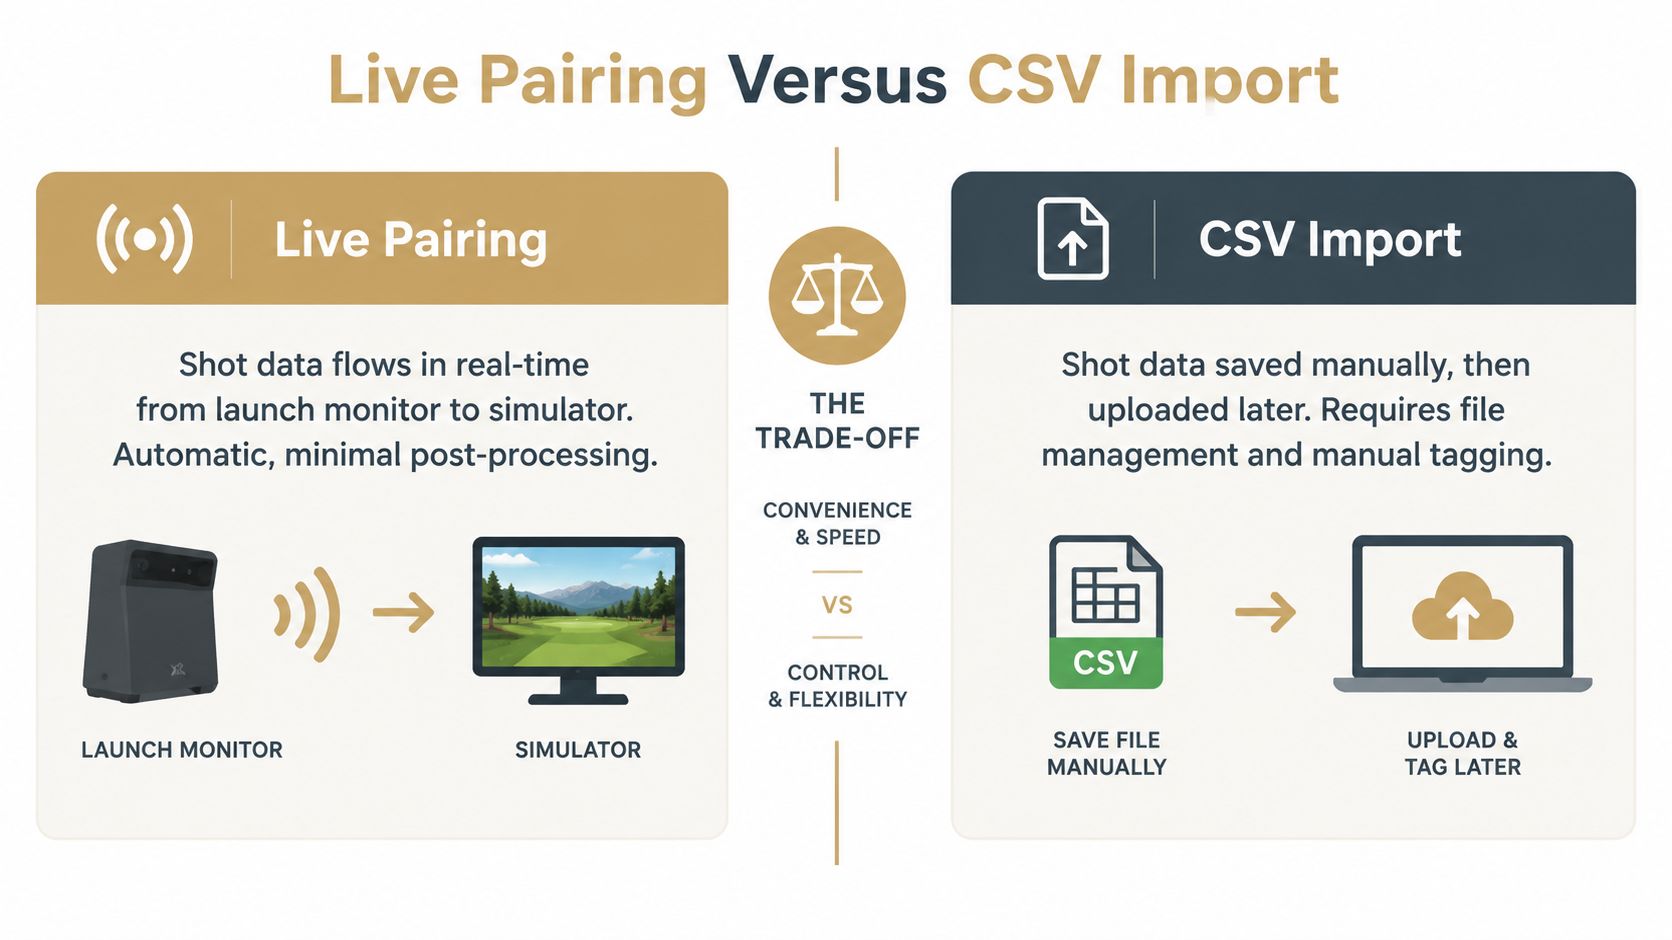
Live pairing and CSV import solve the same measurement problem in different ways. Live pairing streams shots directly from a launch monitor into desktop simulator software, while CSV import waits until the session ends and processes the exported file afterward.
The live workflow is immediate. The golfer strikes an approach, and the desktop environment records the club, carry, trajectory, and relationship to the simulated pin without a separate transcription step. That makes it well suited to structured simulated rounds where every shot needs a hole, a par value, and a target.
CSV import is slower, but it is more flexible. A golfer can finish a range session, export the file from the device application, add hole numbers or par manually, and calculate GIR later. That path works across a broader set of devices because it doesn't require native real-time support between the monitor and the practice software.
Choosing the workflow
| Workflow | Strength | Limitation | Best fit |
|---|---|---|---|
| Live pairing | Immediate shot logging with minimal post-processing | Requires native compatibility | Desktop simulator rounds and repeatable indoor practice |
| CSV import | Device-flexible and manually taggable | Requires file handling and cleanup | Range sessions, mixed equipment, and historical analysis |
Dialed Golf's desktop product uses a live-pair-first approach with Garmin R10 support expanding, while also supporting CSV and import workflows across Garmin, Rapsodo, SkyTrak, FlightScope, Uneekor, GSPro, Awesome Golf, and more. The CSV import workflow is relevant when the golfer wants to preserve a device session and analyze it later.
The practical answer isn't to choose one permanently. Live pairing suits a garage simulator session where speed matters. CSV import suits a range session or a device that isn't natively paired. Both can feed the same GIR calculation if the golfer keeps the par, shot order, landing result, and target fields consistent.
Why Approach-Shot Dispersion Is the Highest-Leverage Practice
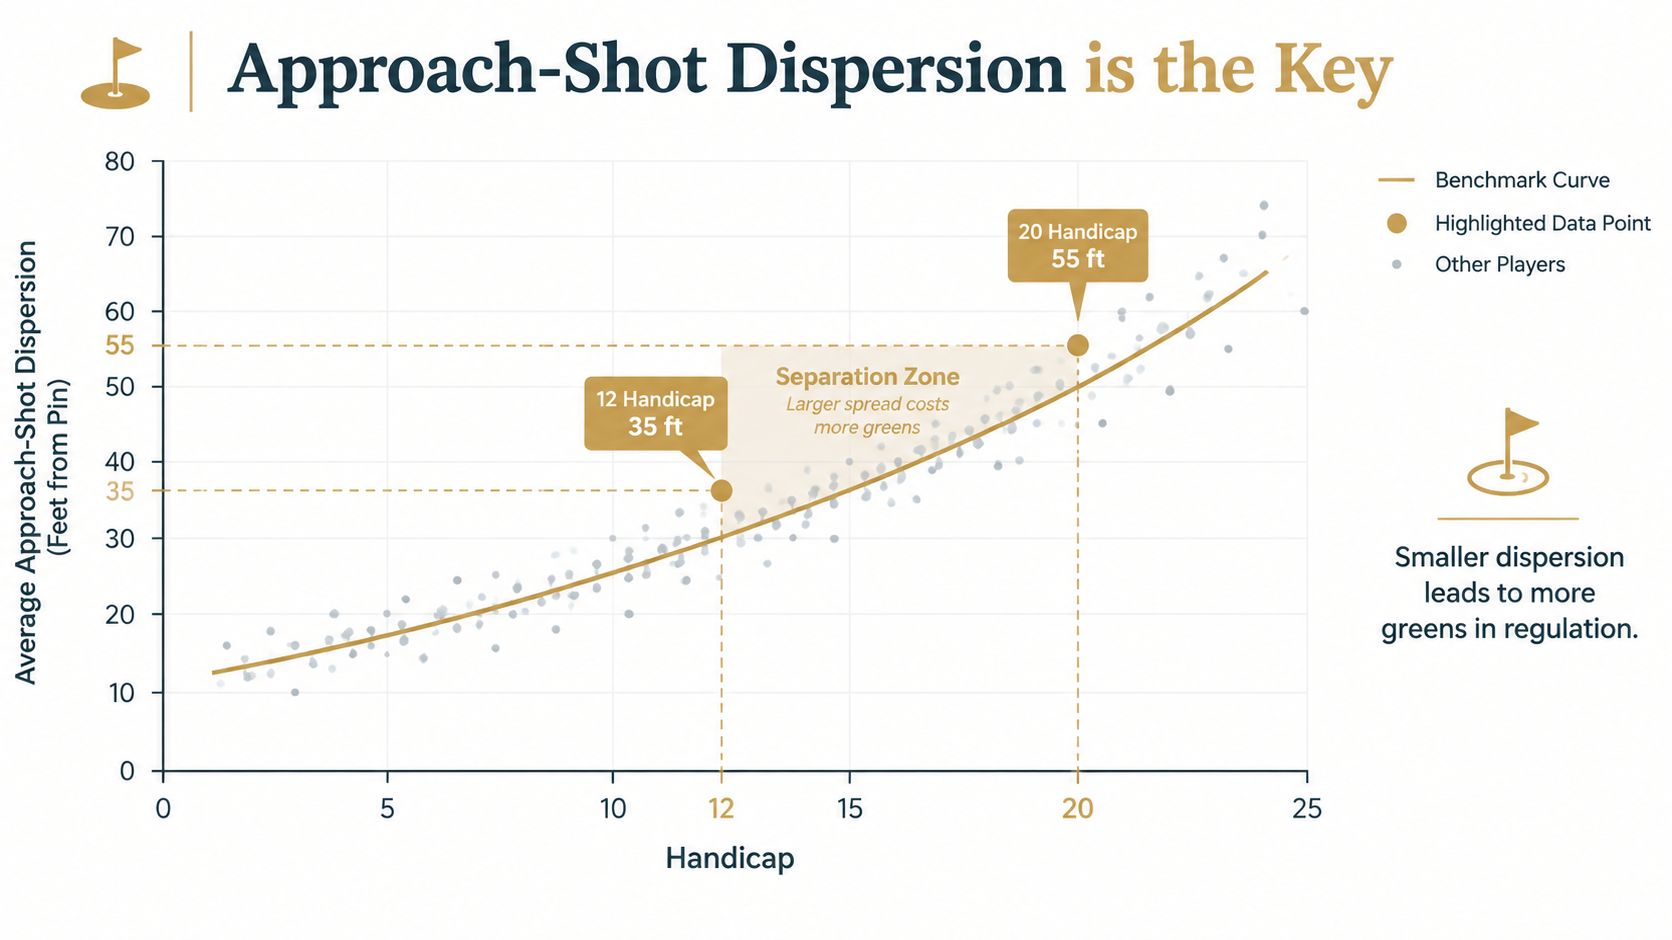
Distance attracts attention because it is easy to see. GIR usually responds more directly to whether the approach pattern stays inside a playable window. A golfer doesn't need a longer club if the current club repeatedly finishes short, long, left, or right of the green.
The benchmark curve supports that priority. The difference between a 10-handicap at 32% GIR and a 15-handicap at 23% GIR is a 9-point gap in one dataset, while the separate distribution places those groups at 35% and 23%. Those figures don't prove that dispersion alone causes the difference, but they support a practical diagnosis: approach results must become more predictable before a golfer can expect a sustained GIR move.
Practice the window, not the highlight
A useful launch-monitor block assigns each club a carry bracket and a side-miss budget. For example, a golfer can work from 150, 175, and 200 yards, using a carry target of plus or minus 5% at each distance. Those values are practice parameters, not population benchmarks. Their purpose is to turn a vague range session into a pass-or-fail test.
The session should answer three questions:
- Carry control: Does the ball reach the intended distance window?
- Lateral control: Does the left-right pattern stay inside the chosen target?
- Miss quality: If the green is missed, does the ball finish in a recoverable location?
Raw distance can improve while GIR remains flat if dispersion expands with it. A shorter but tighter club can create more greens than a longer club that produces a wider pattern.
The wedge practice guide can support the scoring end of this approach, especially when the golfer is calibrating carry and landing behavior rather than chasing maximum speed.
The practice goal is repeatability. Generic volume produces many swings, but dispersion work produces a record that can be compared with the next on-course rounds.
Short-Game Work That Protects the Greens You Miss
Approach improvement doesn't remove every miss. A golfer still needs a reliable response when the ball finishes just outside the green, especially when the miss leaves enough room for a controlled recovery. Short-game practice protects the score while the GIR number develops.
A focused block uses four shot families:
- Tight lie pitch: Control attack angle and dynamic loft so the ball launches predictably from firm turf.
- Fluffy rough: Adjust setup and strike expectations for a lie that changes how the club interacts with the grass.
- Greenside bunker: Monitor face angle and club path, because the delivery determines whether the sand shot carries onto the putting surface.
- Low-running chip: Track ground contact point and landing behavior instead of judging the shot only by finish distance.
A golfer can use 20 attempts per family as a practice structure, then record the percentage of attempts finished in an up-and-down result. The following goals are editorial practice targets, not figures established in the verified GIR datasets.
| Handicap Group | Tight Lie Pitch | Fluffy Rough | Greenside Bunker | Low Chip | Overall Up-and-Down % |
|---|---|---|---|---|---|
| Scratch | 60%+ | 60%+ | 60%+ | 60%+ | 60%+ |
| 10-handicap | 50%+ | 50%+ | 50%+ | 50%+ | 50%+ |
| 20-handicap | 35%+ | 35%+ | 35%+ | 35%+ | 35%+ |
Why the miss still matters
Two golfers can post the same GIR while producing very different scores. One may miss on the safe side with a simple chip, while the other repeatedly leaves short-sided bunker or rough recoveries. GIR identifies opportunity creation, but the short game determines how much damage remains after a miss.
A 10-point scrambling improvement at a 20-handicap level is often modeled as roughly 1.2 strokes per round, but that quantitative claim isn't included in the verified data supplied for this analysis. The defensible conclusion is qualitative: better recovery play can offset part of a GIR deficit without changing approach dispersion.
A missed green is not one outcome. The lie, landing area, and available green determine whether it becomes a routine save or a guaranteed extra stroke.
The practice order should follow the golfer's miss map. If tight lies dominate, pitches and low chips deserve the first block. If bunker misses create the largest score loss, bunker delivery deserves dedicated repetitions rather than occasional attention at the end of a range session.
Putting GIR to Work in a Defensible Practice Plan
A useful plan treats GIR as a measurable feedback signal, not a score to admire. With roughly five hours available for practice, divide the week between two approach-dispersion sessions, one short-game block, and one on-course round with live GIR tracking. The exact schedule can change. Consistent measurement cannot.
A repeatable weekly routine
Use the first launch-monitor session to test carry and distance windows at selected approach yardages. Use the second to repeat those clubs against simulated pins or changing targets. The short-game block should rotate through tight lies, rough, bunkers, and low chips. During the round, mark every green hit and record the miss direction immediately.
At week's end, export the launch-monitor CSV, join it with the on-course notes, and recompute GIR by par 3, par 4, and par 5. A weak result in one par category can expose a distance or decision problem that the total GIR percentage conceals.
GIR isn't the whole scoreboard
More greens create more scoring opportunities, but the count alone does not determine the score. A golfer can improve GIR while still losing strokes through poor recovery positions, frequent three-putts, or penalty shots. A lower-GIR player may score better if missed greens produce manageable recovery shots and fewer blow-up holes.
The proposed comparison of 18% GIR with 45% scrambling versus 22% GIR with 25% scrambling remains a coaching scenario, not a verified performance result. The actionable conclusion is narrower: track GIR and scrambling together each week, then prioritize the skill linked to the costliest misses on the shot map.
The four-week review
After four weeks, compare:
- GIR percentage: Has the rate changed meaningfully?
- Par category: Are par 3s, par 4s, or par 5s weakest?
- Dispersion: Are approach misses clustering more tightly?
- Miss quality: Are recoveries becoming simpler?
- Scoring response: Are fewer approaches producing fewer recovery shots and blow-up holes?
The proposed 2-point GIR increase and 3-yard dispersion reduction are optional coaching thresholds, not universal standards established by the verified data. If performance has not changed, adding practice time without changing the diagnosis is unlikely to help. Adjust the work toward carry calibration, target selection, or the short-game family responsible for the most costly misses.
Dialed Golf connects this workflow across a pocket caddy consumer app, currently distributed through TestFlight rather than general App Store availability, and a desktop launch-monitor practice product with Garmin R10 live pairing first and CSV or import support across multiple ecosystems. Golfer Pro is available across app and desktop at $9.99 per week, $29.99 per month, $149.99 for six months, or $249.99 per year, while Dialed Academy provides range and club memberships and front-desk tools at $99.99 per month or $999.99 per year, with the club keeping its dues. Visit Dialed Golf to track GIR, organize practice data, and turn the benchmark into a repeatable improvement workflow.