


A golfer checks the loft stamped on a 7-iron, finds a chart promising 160 yards, and then watches the ball land at 152. The club isn't necessarily defective, and the chart isn't necessarily wrong. The missing piece is that golf club distances by loft describe a relationship, not a personal guarantee.
Static loft is only the starting point. Delivery, strike, launch, spin, clubhead speed, and turf conditions determine what the ball does. A useful distance plan therefore has two layers: a reference chart to establish expectations, and a measured chart built from repeatable shots with the golfer's own clubs.
Table of Contents
- Why Loft Does Not Give You One Exact Distance
- The Core Concepts Behind Loft and Distance
- What Changes the Loft to Distance Relationship
- Sample Golf Club Distances by Loft
- Measure Your Personal Gaps With a Launch Monitor
- Turn Your Gapping Results Into Better Decisions
- Build a Loft and Distance Practice Plan
Why Loft Does Not Give You One Exact Distance
A loft number tells the golfer how the club is designed to present the face at rest. It doesn't tell the golfer how fast the head will move, where the ball will strike the face, or how much loft the club will deliver at impact.
Three variables usually explain the gap between a chart and a real shot:
- Swing speed: Clubhead speed changes from club to club, even for the same golfer. A longer club may create more speed but less centered contact, while a shorter club may produce a cleaner strike with less speed.
- Club design: Two 7-irons with the same 34° static loft can launch differently because their centers of mass, face construction, and shaft profiles change the way the head delivers energy.
- Strike location: Contact above, below, toward the heel, or toward the toe changes ball speed and the effective launch conditions. The resulting carry can move much farther than the loft stamp suggests.
Consider a range session with one 7-iron. A flush strike at 87 mph may produce a strong, efficient flight. A thin strike at 84 mph may leave the face with a lower launch, different spin, and less carry, even though the club's static loft hasn't changed. The golfer sees two swings with the same club, but the ball experiences two different impact conditions.
The USGA found that driving distance is lowest when impact occurs low on the face, regardless of tee position or club selection, which reinforces why strike quality can overpower a simple loft-based expectation in the study of impact position and driving distance.
Practical rule: Use loft charts to understand the order of your clubs. Use measured carry to decide which club reaches a target.
A golfer who treats “7-iron equals 160 yards” as a fact will chase the wrong solution after a short shot. A golfer who records strike, launch, spin, and carry can identify whether the issue is speed, contact, delivery, or equipment. That distinction turns a frustrating number into a useful gapping diagnosis.
The Core Concepts Behind Loft and Distance
A shot becomes easier to understand when the golfer follows the chain from the club's design to the ball's landing point.
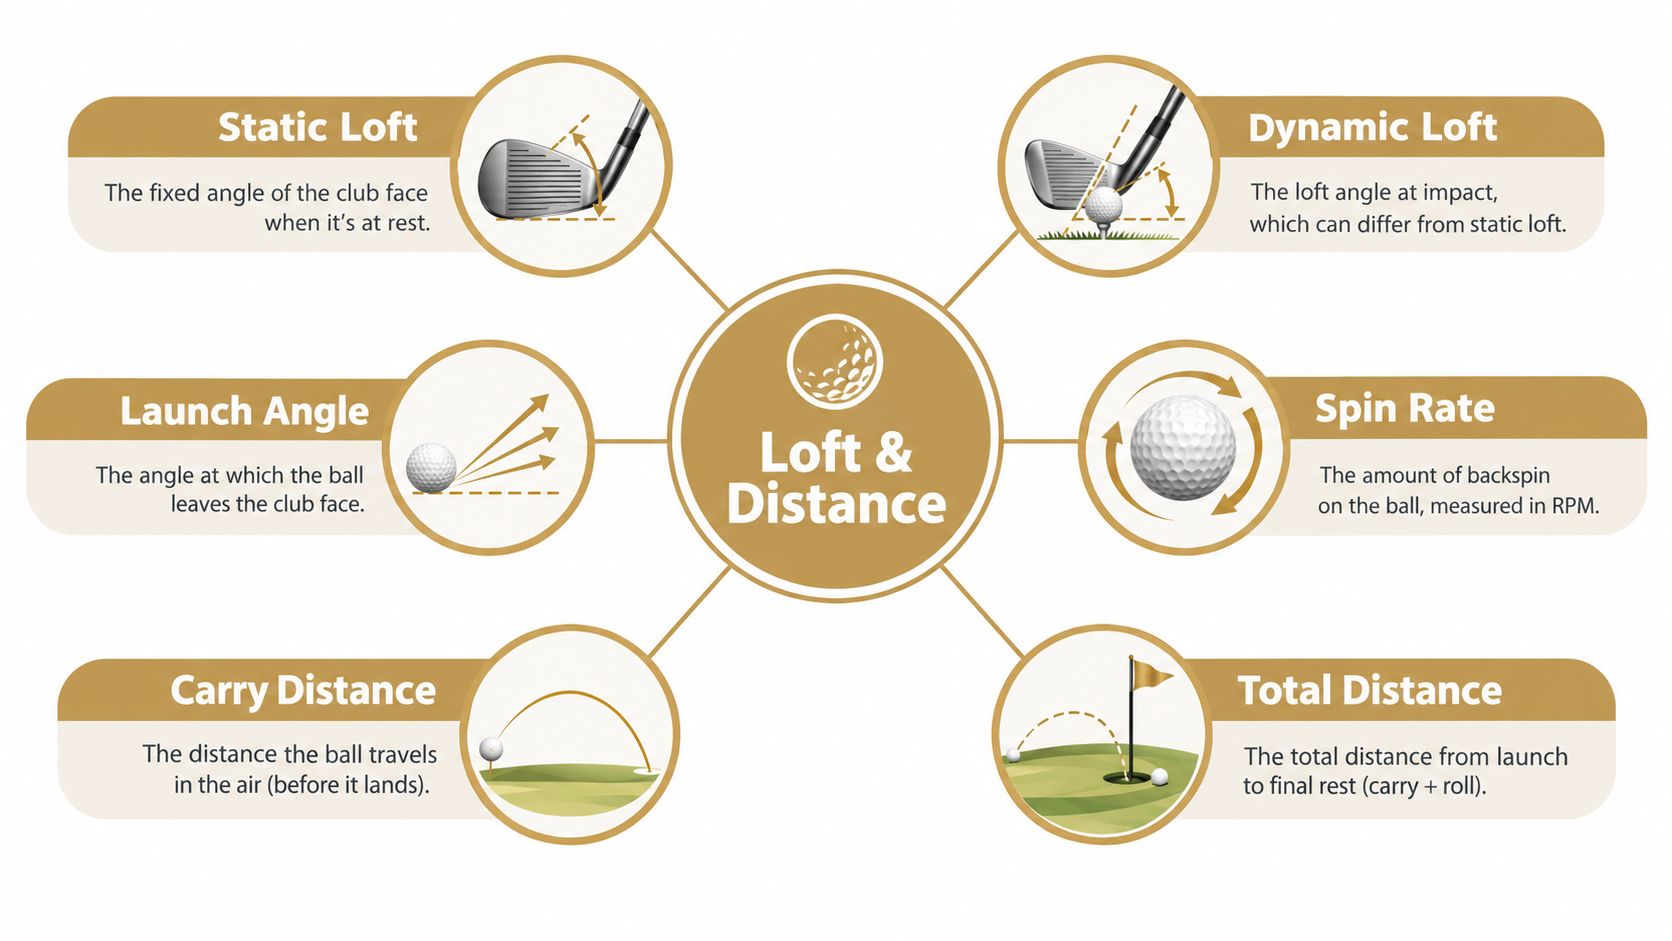
The club and the delivery
Static loft is the loft built into the clubhead when the club is measured at rest. It's the number usually listed in a specification chart.
Dynamic loft is the loft the face presents at impact. Hand position, shaft bending, release pattern, and impact conditions can make dynamic loft higher or lower than static loft. TrackMan describes launch angle as highly correlated with dynamic loft, with launch typically a little lower than the delivered dynamic loft in its technical terminology reference.
Spin loft is the difference between dynamic loft and angle of attack. A technical explanation of launch angle and spin in golf defines that relationship and connects the size of the gap to friction and spin creation.
For a simple model, consider a 7-iron with:
- 34° static loft
- 30° dynamic loft
- 12° angle of attack
- 18° spin loft
- Approximately 24° launch
- Approximately 6,200 rpm spin
Those inputs combine to produce a particular carry and rollout result. The exact yardage still depends on clubhead speed, ball speed, strike location, and environmental conditions, so the example demonstrates the chain rather than promising a universal number.
From launch to landing
Launch angle describes the ball's initial upward direction. It isn't identical to static loft because the golfer's delivery and impact location alter the delivered conditions.
Spin rate affects how the ball climbs, holds its flight, and descends. More spin can help a shot stay in the air and stop faster, but excessive spin can also reduce efficiency for some clubs and swing conditions. The relationship between driver loft, launch, and horizontal distance changes with speed and ball speed, as shown in research on the effect of static driver loft on launch variables and distance.
Carry distance ends where the ball first lands. Total distance includes the rollout after landing. Rollout changes with spin, landing angle, turf firmness, slope, and wind, so carry is the safer number for clearing a hazard or reaching the front of a green.
Change one part of the chain and the rest can move. A stronger delivery may reduce dynamic loft, alter launch, increase or reduce spin loft, and change both carry and stopping power. That's why a loft-based chart works best as a map of relationships, not as a substitute for a personal launch-monitor record.
What Changes the Loft to Distance Relationship
Strike quality often changes distance more than the golfer expects. A centered strike preserves ball speed and produces the intended launch conditions. A heel or toe strike can reduce efficiency, while a thin strike can change the delivered loft and launch dramatically. A fat strike loses energy before impact and may produce a higher-looking but shorter shot.
A 12 mm off-center hit with the same 7-iron can carry materially less than a flush strike because the ball doesn't receive the same combination of speed, centered contact, and face delivery. The number on the club hasn't changed, but the effective shot conditions have.
Why the same loft can fly differently
Clubhead construction changes how a golfer turns loft into launch. A lower center of gravity can help an iron launch higher at a given static loft. Face flexibility and head design can influence ball speed retention on imperfect strikes. Shaft weight and flex can also affect how much dynamic loft the golfer delivers and where the strike occurs.
Modern lofts create a second source of confusion. A historical comparison lists a 3-wood at 13° to 15° in 2025 versus 15° to 17° in 1990, a 5-wood at 20° to 23° versus 21° to 24°, a 3-iron at 21° to 24° versus 23° to 25°, and a pitching wedge at 44° to 48° versus 51° to 54°, as shown in this comparison of golf club distance charts and loft trends.
A modern 7-iron near 28° and a legacy 7-iron near 34° can produce similar carry for a golfer if the modern head launches higher or preserves more ball speed. Calling both clubs “7-iron distance” hides the fact that they're different tools.
| Era | Static Loft | Dynamic Loft | Launch Angle | Spin Rate (rpm) | Approx Carry (yds) |
|---|---|---|---|---|---|
| Legacy 7-iron example | 34° | 30° | 24° | 6,200 | Personal measurement required |
| Modern 7-iron example | 28° | Delivery dependent | Delivery dependent | Delivery dependent | Personal measurement required |
The practical lesson is simple. If a chart feels wrong, the golfer should check the actual lofts, strike pattern, and launch data before changing clubs. A gap that disappears between two irons may be a swing issue, a head-design effect, or a loft progression problem.
Sample Golf Club Distances by Loft
The following table is a reference ladder, not a personal yardage chart. A widely used modern loft reference places a 10.5° driver at roughly 225 to 240 yards for men, a 15° 3-wood at 205 to 220, a 19° 5-wood at 190 to 205, a 23° 4-hybrid at 170 to 185, and a 28° 5-iron at 155 to 170, according to this golf club loft chart.
The same reference shows women's carries for those clubs at approximately 145 to 170, 130 to 155, 120 to 145, 110 to 135, and 100 to 125 yards, respectively, using the same loft ladder. Those are broad reference windows, not guarantees for any individual golfer.
| Club | Typical Static Loft (degrees) | Carry Window (yards) | Total Distance Window (yards) |
|---|---|---|---|
| Driver | 9° to 12° | 225 to 240 | Conditions dependent |
| 3-wood | 13° to 15° | 205 to 220 | Conditions dependent |
| 5-wood | 18° to 21° | 190 to 205 | Conditions dependent |
| 4-hybrid | 22° to 24° | 170 to 185 | Conditions dependent |
| 5-iron | 25° to 28° | 155 to 170 | Conditions dependent |
| 6-iron | 28° to 31° | Personal measurement required | Conditions dependent |
| 7-iron | 32° to 35° | Personal measurement required | Conditions dependent |
| 8-iron | 36° to 39° | Personal measurement required | Conditions dependent |
| 9-iron | 41° to 45° | Personal measurement required | Conditions dependent |
| Pitching wedge | 44° to 48° | Personal measurement required | Conditions dependent |
| Gap wedge | 48° to 54° | Personal measurement required | Conditions dependent |
| Sand wedge | 54° to 58° | Personal measurement required | Conditions dependent |
| Lob wedge | 58° to 64° | Personal measurement required | Conditions dependent |
The table illustrates why the long game needs deliberate gapping. Loft bands are more spread out among woods and hybrids, while scoring clubs can have closely packed lofts and therefore smaller distance differences. A hybrid golf club loft chart can help golfers inspect that upper-bag transition without relying only on club numbers.
Three cautions matter:
- Ranges overlap: Similar lofts can produce similar carries, especially when strike or speed changes.
- Modern sets run stronger: A current iron may carry farther than an older yardage book suggests because its loft is lower.
- Total distance is unstable: Rollout depends on landing conditions, spin, slope, wind, and turf, so carry should anchor the chart.
Measure Your Personal Gaps With a Launch Monitor
A golfer can leave a launch-monitor session with a long carry number and still have no usable gapping plan. The better test asks what a repeatable stock swing produces, then records how static loft, delivery, contact, and landing conditions shape both carry and rollout.
Prepare the test
Test outdoors or indoors, but keep the main conditions consistent. Use the same ball, comparable temperature, and the same strike intention. A driver may need a high tee while an iron comes from a mat, yet changing ball type or testing one club in strong wind and another in calm air makes comparisons harder.
Begin with the shortest club and warm up gradually. A wedge establishes rhythm before longer swings, reducing the chance that cold contact distorts the first part of the chart.
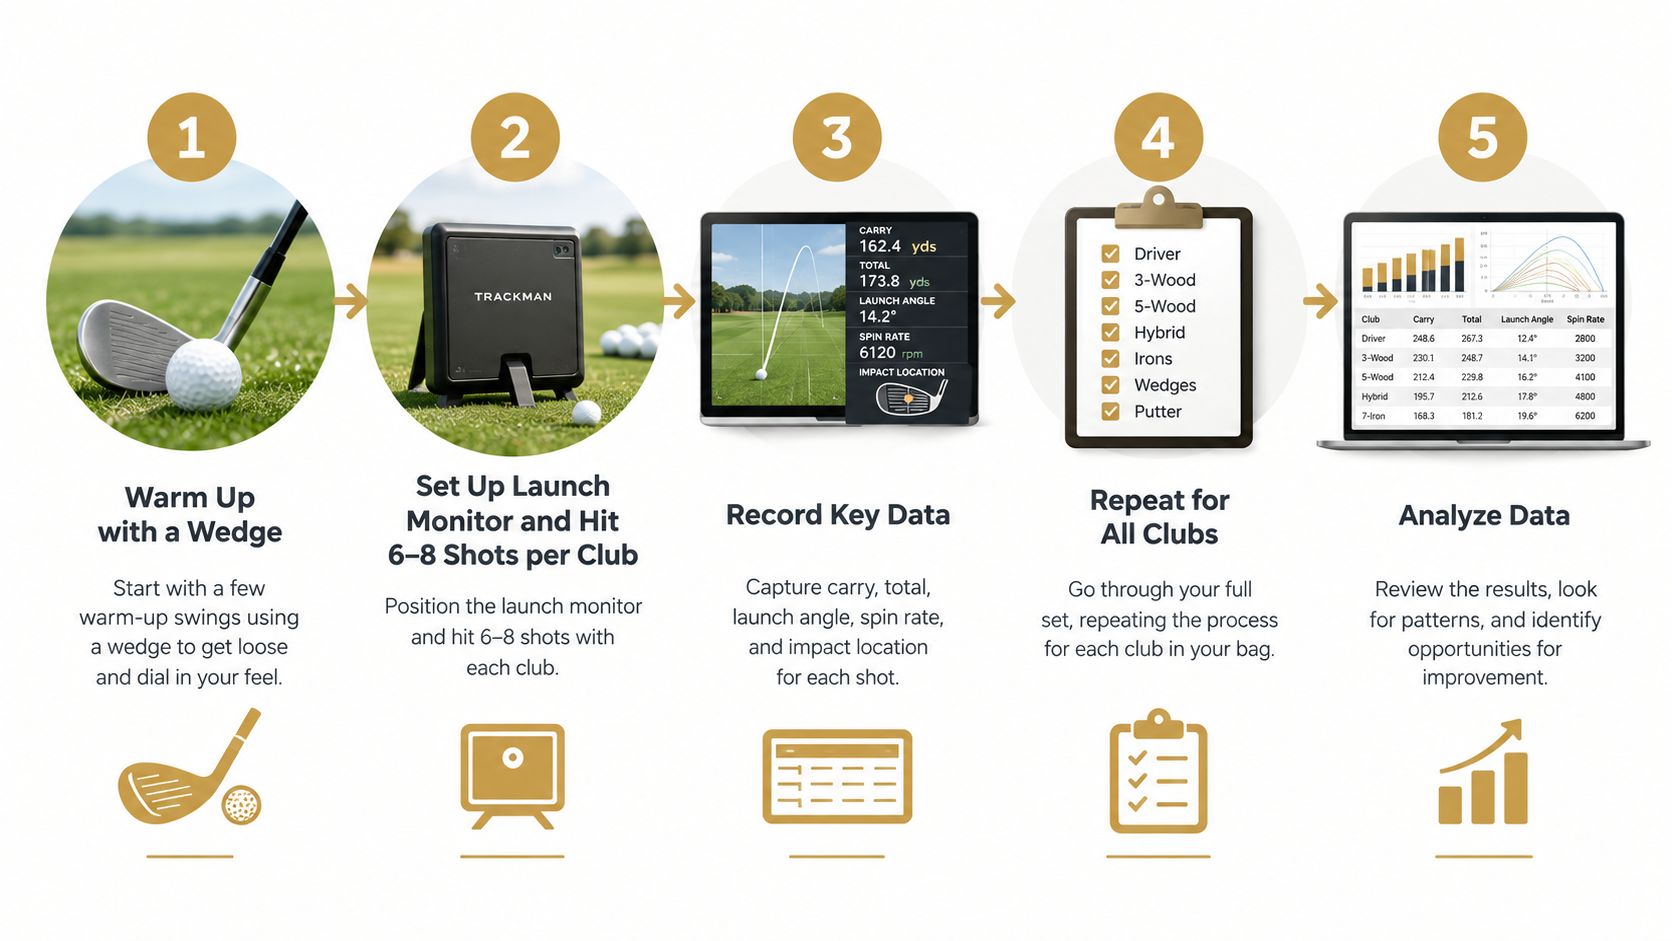
Use this protocol:
- Warm up: Start with a short club and build toward full swings.
- Test each club: Hit 5 to 8 stock shots per club, aiming for the shot you could repeat on the course.
- Reject obvious misses: Remove shots that are clearly fat, thin, wildly offline, or outside the intended pattern.
- Use the median carry: Sort the valid carries and select the middle result, rather than rewarding the longest swing.
- Repeat consistently: Keep the target, routine, and effort level stable from club to club.
Record the right fields
Carry anchors club selection because it describes how far the ball travels before landing. Total distance adds context for rollout, but it should not replace carry when the goal is clearing a hazard or choosing an approach distance.
Record:
- Club and static loft
- Carry and total distance
- Launch angle
- Spin rate
- Ball speed and clubhead speed
- Attack angle
- Impact location
- Shot quality notes
These fields explain the result behind the number. For example, a short carry with low launch and low-face contact suggests a different issue from a short carry produced by centered contact, high spin, and excessive dynamic loft. Static loft is the club's stated angle. Dynamic loft is the loft delivered at impact, and it helps determine launch and spin. Strike location then changes ball speed and launch, while landing angle and spin influence how much the ball rolls after it touches down.
Save the results as a session instead of leaving them in a loose note. Dialed Golf's launch-monitor app workflow can help organize repeated practice data and compare sessions over time. Its desktop app can pair with a launch monitor or import session files, so a test can be saved and reviewed again rather than rebuilt from memory.
A useful chart has two layers: median carry for club selection and total distance for course planning. Add the launch, spin, and strike notes beside each club, and you can distinguish a genuine gap from a one-off ball-speed spike or unusual rollout.
A short visual guide can reinforce the test sequence:
Turn Your Gapping Results Into Better Decisions
Raw launch-monitor numbers become useful after the golfer sorts them into carry windows and compares adjacent clubs. A single carry value can look tidy, while a window reveals whether the club is dependable or only long when contact is perfect.
For each club, keep the valid-shot results and identify the central carry range. Then compare neighboring clubs:
- Gap size: Subtract the shorter club's median carry from the longer club's median carry.
- Overlap: Check whether the normal carry windows occupy the same space.
- Flight quality: Review launch, spin, descent behavior, and strike location.
- Cause: Decide whether the issue looks like delivery, contact, or equipment.
The paper plan calls for flagging pairs separated by less than roughly 8 to 10 yards, but that flag is a prompt for investigation, not proof that a club must be removed. If both clubs produce reliable, different trajectories, a smaller gap may still serve a purpose.
Rank the likely fix
A collapsed gap usually belongs in one of three decision buckets.
Practice focus applies when strike location varies or the golfer adds and removes dynamic loft unpredictably. Low-point control, tempo, and a repeatable stock motion come before equipment changes.
Small adjustments may involve grip, ball position, or a shaft change when the launch data points to a delivery pattern that isn't producing the intended flight.
Fitting conversations make sense when the same pattern remains after repeatable swings. Loft, lie, head design, and shaft profile can then be tested under controlled conditions.
The chart shouldn't tell the golfer what to buy. It should tell the golfer what question to test next.
Dialed Golf can store sessions, visualize carry gaps and overlaps, and organize the next test as a workflow layer around the golfer's existing launch monitor. Its gap-analysis guide provides a related framework for turning adjacent-club results into decisions.
The brand operates through three products tied to one golfer record and one Pro plan. Free web tools remain free and serve as the top of the funnel, not as a disguised Pro requirement. Golfer Pro costs $9.99 per week, $29.99 per month, $149.99 for six months, or $249.99 per year across app and desktop. Dialed Academy serves ranges and clubs with memberships and front-desk functionality at $99.99 per month or $999.99 per year, with the club keeping its dues.
Build a Loft and Distance Practice Plan
A golfer standing over two clubs with similar lofts may see different carry gaps because strike, delivery, launch, spin, and rollout all change the result. Build practice around those variables, then record the carry window and total distance for each club. The goal is a usable gapping plan, not one ideal yardage.
Use three focused blocks:
- Stock-yardage block: Hit each selected loft with a repeatable motion. Record median carry, total distance, launch, spin, and strike location.
- Strike block: Test centered, low-face, heel, and toe contact with the same club. Compare carry loss, launch, spin, and rollout.
- Recheck block: Hit three fresh shots per club, remove obvious mishits, and update the carry window. Check whether adjacent clubs overlap or leave a playable gap.
Loft changes should follow a repeatable pattern. If measured carry repeatedly misses the intended target by more than 6 yards, spin sits outside 2,500 to 3,000 rpm of the expected band, or contact keeps drifting heelward or to the toe, record the delivery issue for a fitting discussion. These triggers identify what to investigate before changing equipment.
A launch-monitor practice workflow can organize each test and preserve the results. Treat every session as a measurement with a question attached. Each block should answer something about loft, strike, delivery, or gapping and define the next test.
Dialed Golf helps golfers organize launch-monitor sessions, compare personal carry windows, and identify gaps or overlaps across the bag. Its consumer app provides a pocket caddy workflow, while its desktop product supports practice data. Visit Dialed Golf to build a measured loft-and-distance plan around the clubs and launch monitor already in use.