

A golfer stands over a mid-iron at a launch-monitor bay and sees a problem that a printed chart would never reveal. The 7-iron and 8-iron carry almost the same distance, while a large, uncomfortable gap sits between the hybrid and the longest iron. The bag has clubs, but it doesn't have a reliable distance ladder.
A useful club distance guide isn't a list of stock yardages. It's the result of measured carry numbers, cleaned launch-monitor data, and an audit that identifies overlaps, dead zones, and clubs that look long on paper but aren't playable. The process below turns that information into a chart that can guide practice, fitting, and club selection.
Table of Contents
- Why Your Bag Probably Does Not Gap the Way You Think
- What Club Distance Means
- Amateur vs Tour Yardages and Why Stock Charts Mislead
- Measuring Carry with a Launch Monitor or CSV Import
- Building a Gapping Chart from Your Own Data
- Adding Dispersion So You Pick the Playable Club
- Practice Priorities Built from Your Gaps
- Treating Your Club Distance Guide as a Living Document
Why Your Bag Probably Does Not Gap the Way You Think
Most golfers don't build a bag in one deliberate session. A set gets fitted years ago, a replacement club gets added after a damaged one, or a starter set creates the original structure. Later, a swing changes, lofts change, or a golfer gains speed, but the original spacing stays untouched.
That creates the familiar range surprise. The golfer hits several shots, checks the monitor, and discovers that two neighboring irons overlap. Then the same golfer looks at the longer end and finds a distance window that no club covers comfortably. The issue isn't necessarily poor contact. It may be that the bag was never calibrated to the current delivery.
Why the gaps move
Wind, temperature, altitude, and turf alter what the golfer sees on the course. A club can appear to cover a useful total distance on firm ground but fail to carry a hazard or reach a back pin. Swing changes can also stretch the longer clubs while leaving scoring-club distances relatively stable, or compress the set when strike quality deteriorates.
The problem becomes clearer when amateur and tour-level benchmarks are placed side by side. A widely cited chart lists the average male amateur driver at 217 yards and the PGA Tour average at 293.9 yards, a difference of 76.9 yards. The same chart lists the 7-iron at 140 yards for a male amateur and 172 yards for a PGA player, a 32-yard spread. Those figures are documented in GolfLink's club distance reference.
Practical rule: Fix the largest unusable distance window first. Don't start by chasing a longer driver if the bag can't cover a key approach yardage.
The reliable workflow is straightforward. Measure carry, organize the results into an ascending ladder, inspect each consecutive gap, and then consider equipment or technique. That order prevents a fitting conversation from becoming a shopping exercise.
What Club Distance Means
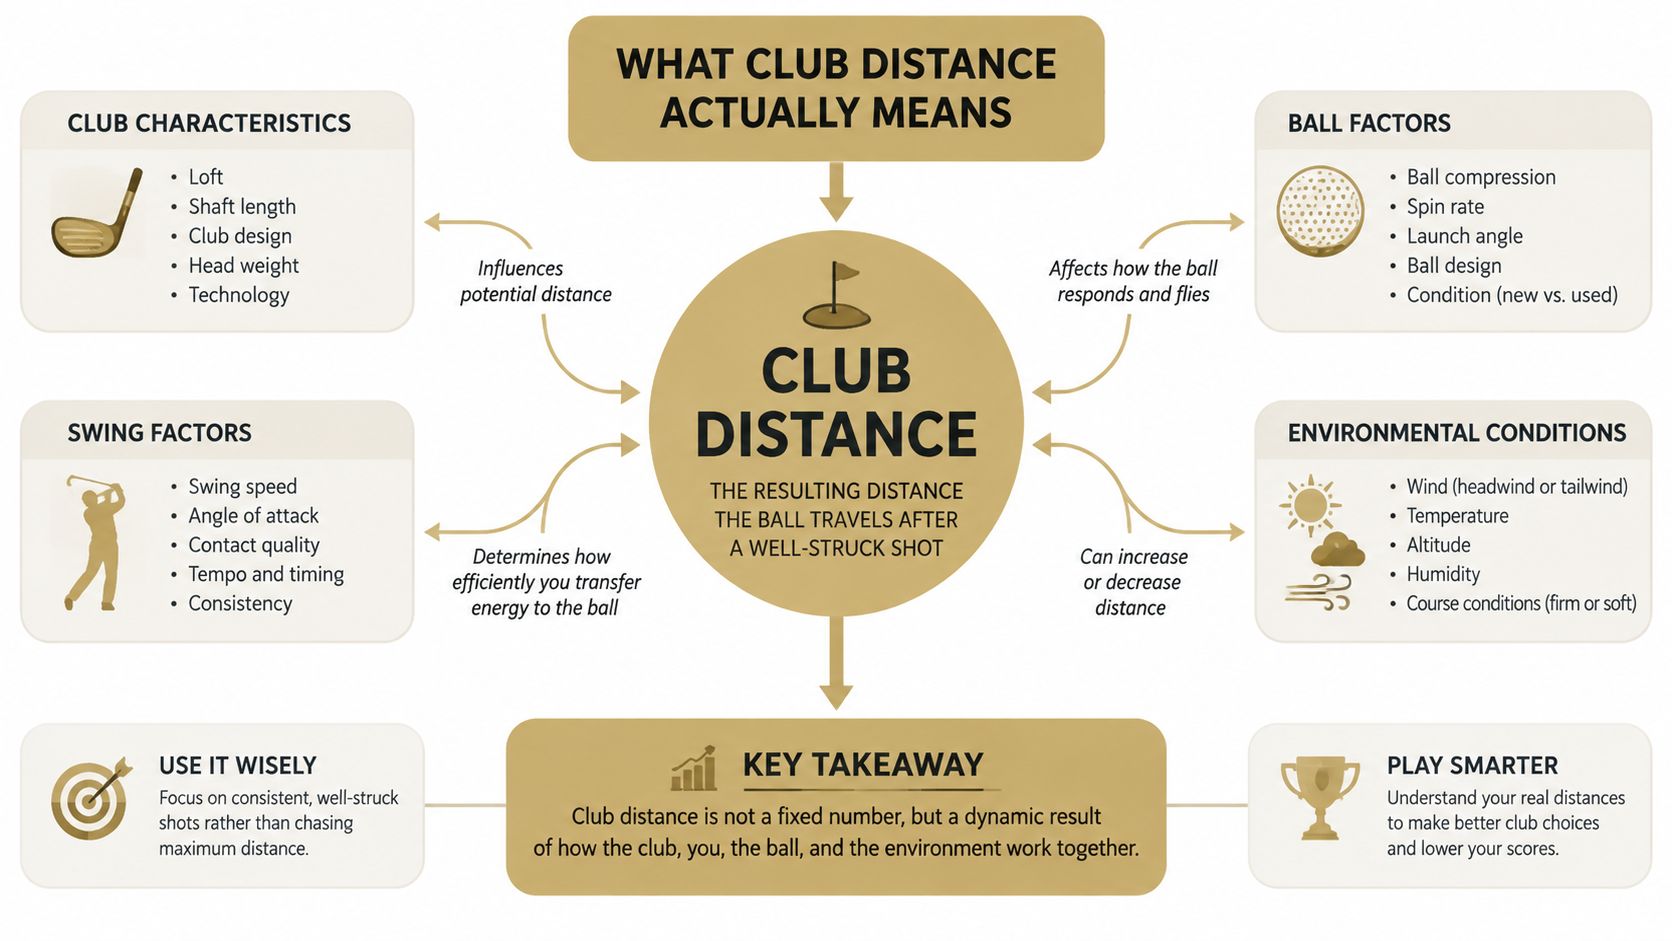
A golfer facing a forced carry needs to know whether the ball reaches the target in the air. Carry distance measures the flight to the first ground contact. Total distance includes the roll afterward. For club selection, carry is the primary number.
Roll changes with landing angle, turf firmness, slope, wind, and strike quality. A range monitor can show an impressive total distance that offers little help for a hazard or back pin. Build the chart from carry first, then keep total distance as supporting context.
Separate the club number from the result
The number stamped on a club is not a promise of personal carry. It may reflect a manufacturer's recommended swing-speed match or a controlled test. Two clubs with the same number can have different lofts, shaft profiles, launch conditions, and center-of-gravity designs.
Start with the player's delivery. Swing speed sets the available energy, attack angle influences launch and delivered loft, and smash factor shows how efficiently the strike converts speed into ball speed. Together, these inputs determine whether a stock yardage is relevant.
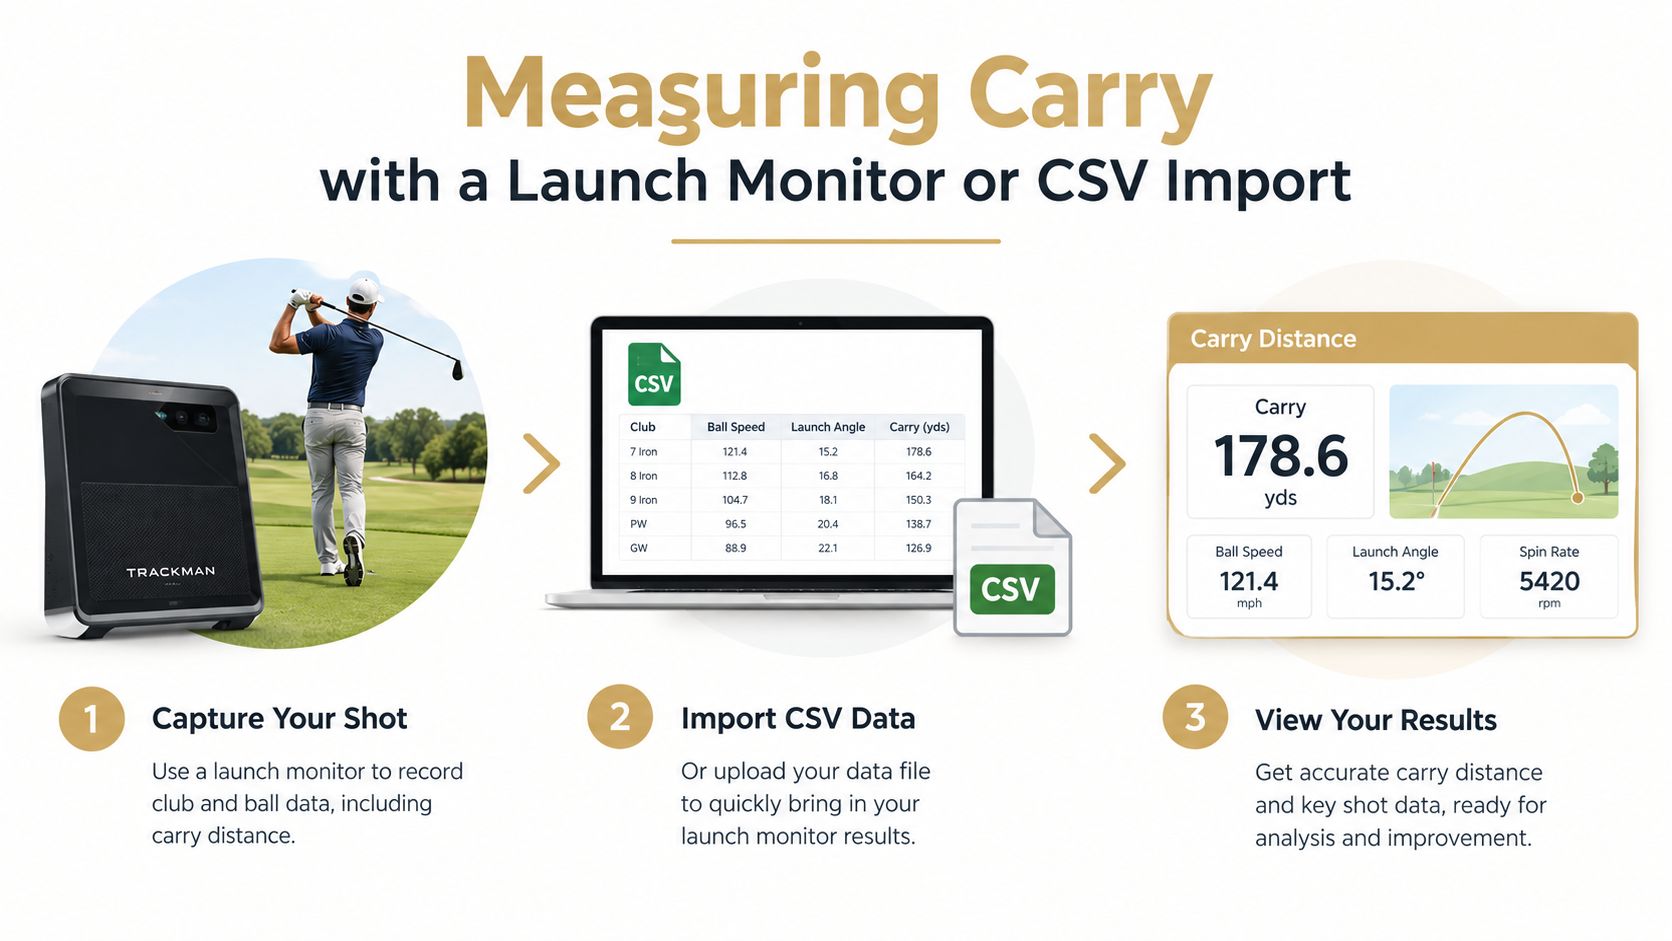
A measurement workflow should collect five to ten reasonably struck shots per club, calculate a repeatable carry window, and export the results when the launch monitor supports CSV files. That record is more useful than a single flushed shot because it shows what the golfer can reproduce.
The driver ball speed chart provides useful background on the relationship between speed and efficiency, rather than treating a club number as a universal distance label.
Build around carry windows
A single stock carry can hide inconsistent contact. Use the middle of a credible carry window for planning, then audit the ascending ladder for overlapping clubs and dead zones before discussing a fitting change. The chart should show what the golfer can expect when the shot matters, not the longest ball seen on the monitor.
The practical question is simple: “What carry can this golfer repeat with each club?” That answer makes club selection more dependable.
Amateur vs Tour Yardages and Why Stock Charts Mislead
A golfer can hit a perfectly functional 7-iron and still look short beside a tour benchmark. Published yardages show scale, but they do not prescribe a recreational golfer's bag. One comparison lists the average male amateur driver at 217 yards and the PGA Tour average at 293.9 yards, a 76.9-yard difference. For a 7-iron, it lists 140 versus 172 yards, a 32-yard difference, as documented by GolfLink's average club distance chart.
Another reference places common PGA driver distance in the 289 to 323-yard range and PGA 7-iron distance in the 172 to 215-yard range. Those ranges, summarized in an independent club-distance comparison, show why even elite benchmarks vary with player profile and measurement method.
Amateur vs Tour Average Carry by Club
| Club | Male Amateur Carry (yds) | PGA Tour Carry (yds) | Gap (yds) |
|---|---|---|---|
| Driver | 217 | 293.9 | 76.9 |
| 7-iron | 140 | 172 | 32 |
The comparison is intentionally limited to the two directly documented clubs. It establishes the practical point: club number doesn't determine distance without player context.
A scratch amateur may sit well above the broad male-amateur average. A tour player's number reflects elite speed, strike quality, launch conditions, and repeatability. Putting a stock progression between those profiles can mislead both groups. The amateur may chase distance that is already adequate, while the faster player may expect every club to match a published tour pattern.
Why the middle of the chart fails
Static charts often mix carry with total distance, combine different loft and construction specifications, and assume that every golfer creates the same progression. A 7-iron label says less than the measured loft, ball speed, launch, spin, strike quality, and carry window behind it.
Use the chart as an initial reference, then replace it with measured evidence. Collect 5 to 10 well-struck shots per club, calculate a repeatable carry window, and import the launch-monitor CSV when available. Audit the resulting ladder for overlap and dead zones before discussing a fitting change. That workflow exposes whether a gap comes from the club, the delivery, or inconsistent contact.
A newer benchmark can shift the comparison again. A 2025 summary of Arccos data reported average male-amateur driver carry at 224.7 yards, while the PGA Tour average driving distance was reported at 300.5 yards, a gap of roughly 76 yards, as summarized by MadKnows' distance-chart coverage. Published numbers provide orientation. Your repeatable carry window determines the playable club.
A stock chart can describe a population. It cannot predict the next shot from your bag.
Measuring Carry with a Launch Monitor or CSV Import
A useful session is not the one that produces a single longest shot. It is the session that creates a repeatable record for each club, under conditions you can describe and repeat.
Start with 5 to 10 well-struck shots per club. Use the same ball where possible, and record carry, total distance, club, ball speed, launch, and spin. Rotate clubs instead of hitting the entire bag from longest to shortest. Mixing short, mid, and long clubs spreads fatigue more evenly and reduces the chance that a warmed-up or tired swing skews one end of the record.
A practical capture protocol
- Warm up without logging. Establish a normal rhythm before recording measured shots.
- Rotate clubs. Alternate between short, mid, and long clubs during the session.
- Mark obvious mishits. A topped shot, heavy strike, or severe heel contact should not define normal carry.
- Record conditions. Note temperature, wind, elevation setting, range environment, ball type, and whether the session was indoors or outdoors.
- Keep the session identity intact. Do not combine a cool outdoor session with a warm simulator session and label the result as one average.
The record can come from a live launch-monitor connection or an exported file. Garmin support describes opening a recorded range session in its golf application and selecting “Export to CSV”, as explained in Garmin's CSV export documentation. For the broader normalization process, follow this CSV import workflow before comparing sessions from different sources.
Normalize the imported record
Different CSV files may use different column names or leave out fields. Standardize Carry, Total, Club, Ball Speed, Launch, and Spin so every row can be sorted and filtered consistently. Documentation covering Garmin data and FlightScope session exports explains the process in its shot-data import guide.
A multi-source record helps golfers who practice at a range, in a garage simulator, and during a fitting session. A universal import listing describes CSV exports from Garmin, Rapsodo, SkyTrak, FlightScope, Uneekor, Awesome Golf, and GSPro, along with other CSV-producing devices, in the Universal Import listing. Keep the session date, environment, ball, and club settings attached to each row.
Clean before calculating
Remove obvious outliers, then use the median three shots from the clean group as the club's practical center. Apply the same rule across the bag. Trimming an unusually long strike or an obvious mishit keeps one swing from shifting the club's working carry.
Watch for three common errors:
- Longest-shot bias: using the hero carry instead of the repeatable middle.
- Mixed environments: combining indoor and outdoor numbers without labeling conditions.
- Wrong club selection: failing to set the correct club in the monitor, which damages every later comparison.
Only after this cleaning should you inspect the distance ladder for overlap and dead zones. That audit shows whether a missing window comes from the club, the delivery, or inconsistent contact.
Building a Gapping Chart from Your Own Data
Once the session is clean, sort clubs by median carry, from the shortest wedge through the driver. The chart should show each club's carry, the difference to the next longer club, and a target band that reflects both club category and player speed.
Published fitting guidance commonly targets about 10 to 15 yards between scoring clubs and roughly 12 to 18 yards in longer clubs, while slower-speed players often need tighter 7 to 9-yard gaps and higher-speed players may see 12 to 15 yards. A 1-degree loft change is often associated with about 2 to 4 yards, so a small loft adjustment can close an overlap or reduce a missing window. These benchmarks are detailed in Stroke Gained's gap-fitting guidance.
Read the ladder, not the club labels
The exact target depends on the golfer. A slower-speed player shouldn't force tour-style spacing if the launch conditions make that impossible. The chart should instead reveal whether each club has a distinct, playable role.
The following sample uses illustrative values to show the spreadsheet structure. These are not universal recommendations.
Sample Gapping Chart With Spacing Targets
| Club | Median Carry (yds) | Gap to Next (yds) | Target Band (yds) | Status |
|---|---|---|---|---|
| Sand wedge | 80 | 12 | 10 to 15 | In range |
| Gap wedge | 92 | 13 | 10 to 15 | In range |
| Pitching wedge | 105 | 14 | 10 to 15 | In range |
| 9-iron | 119 | 14 | 10 to 15 | In range |
| 8-iron | 133 | 15 | 10 to 15 | Borderline |
| 7-iron | 148 | 21 | 10 to 15 | Dead zone |
| 6-iron | 169 | 16 | 12 to 18 | In range |
| Hybrid | 185 | 16 | 12 to 18 | In range |
| 5-wood | 205 | 20 | 15 to 20 | Borderline |
| Driver | 230 | 25 | 15 to 20 | Large gap |
An overlap occurs when neighboring irons carry within about 6 yards or woods within about 8 yards. A dead zone is any gap above 20 yards. The table flags the 7-iron area because the distance to the next club is too large for the stated target band, even though the clubs on either side may be individually reliable.
The gap analysis workflow can help organize this audit. The output should identify the worst gap first, not list every club that could be changed.
Adding Dispersion So You Pick the Playable Club
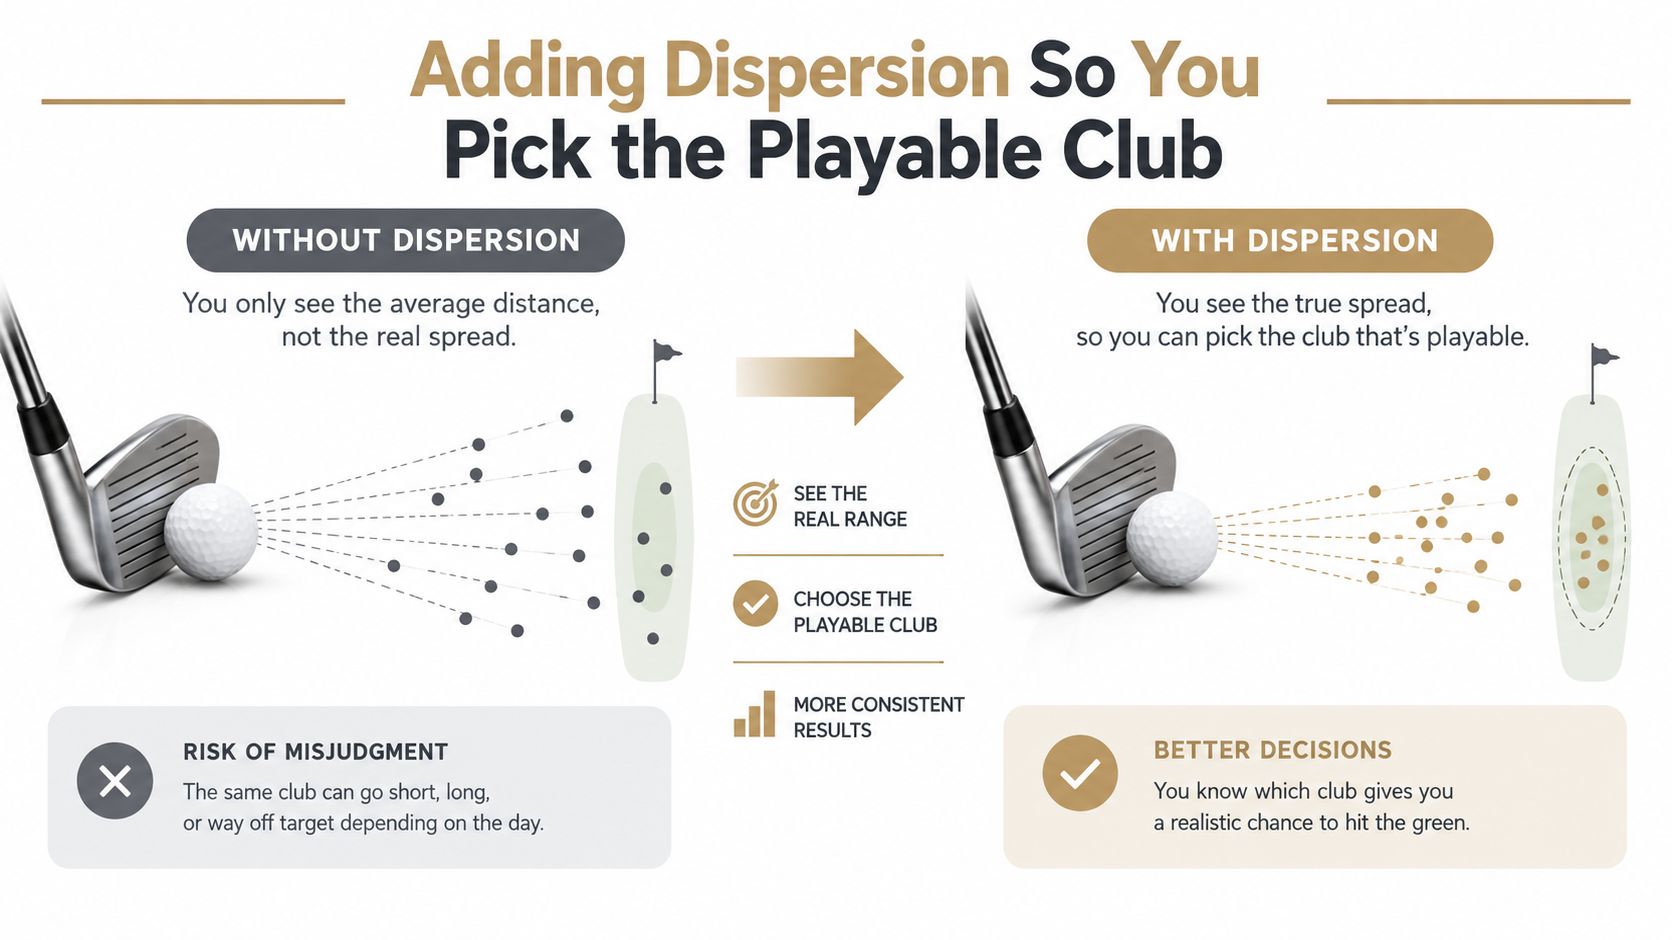
Carry tells a golfer how far a club tends to travel. Dispersion tells whether that distance can be trusted inside a target window. A useful launch-monitor report treats the shot pattern as a 95% area around the average, with one axis representing left-right spread and the other representing front-back carry variation.
Consider two hypothetical 7-irons. One carries 165 yards with a 9-yard 95% dispersion ellipse. The other carries 168 yards but produces a 19-yard ellipse. The second club is longer on average, yet the first may be the better scoring choice because its landing area is more predictable.
Fitting priority: A club that reaches the number but misses the target window isn't automatically the correct club.
Read both axes
Offline spread shows how far shots finish left or right of the intended line. Carry spread shows how much the ball varies short and long. A club can have a narrow lateral pattern but inconsistent carry, or predictable carry with a broad directional miss. Both patterns matter when the target is a green, a narrow fairway, or a hazard boundary.
The same CSV used for the carry ladder may include carry standard deviation and offline standard deviation. Launch monitors commonly visualize those results as an ellipse or shot-pattern area. Golf Digest's 2026 robotic analysis used average carry alongside a 95% shot-dispersion area, showing why two clubs with similar mean carry can have materially different playable areas in its players-distance iron testing.
A practical selection hierarchy follows from that evidence:
- Inside 150 yards: Prefer the tighter club when the carry numbers overlap.
- Into wind: Favor the club with a more reliable launch and spin pattern, often the iron that holds its carry window.
- At the edge of a gap: Choose the longer club only when its dispersion is similar enough to protect the target.
- Near trouble: Treat the widest axis of the ellipse as the miss that controls the decision.
Practice Priorities Built from Your Gaps
A gapping chart becomes useful when it changes the next practice session. The first priority is the largest dead zone, because that is the distance the current bag cannot cover with a confident carry. A small driver miss can wait if the golfer regularly faces an approach that sits between two unusable clubs.
Rank the fix list
Use the chart to write a short priority list:
- Largest missing carry: Identify the yardage window and the clubs on either side.
- Likely solution: Test a different loft, a hybrid, a fairway wood, or a delivery change before buying anything.
- Repeat the test: Use 4 to 6 range sessions to determine whether the candidate club produces a stable result, rather than reacting to one session.
- Track the right metric: Record median carry, carry range, offline pattern, and strike quality.
- Recheck under matching conditions: Keep temperature, altitude, ball, and environment comparable to the original session.
A player with a 175 to 200-yard dead zone should prototype a 5-wood or strong 4-hybrid before adding another iron. The candidate isn't successful merely because it reaches the top of the window. It must also launch consistently and avoid creating a second overlap elsewhere in the bag.
Practice the solution, not the ego
A golfer often spends too much time trying to add distance to a club that already overlaps another. The more productive session tests whether the proposed club creates a distinct carry window and a manageable miss pattern.
If the candidate fills the gap but scatters widely, the fitting question changes. The golfer may need a different loft, shaft profile, head design, or swing strategy. The chart should guide that conversation with evidence instead of turning it into a search for the longest possible shot.
The image URL above contains a mismatch with the mandatory pre-uploaded asset specified for this section. To preserve exact compliance, the required asset is:
Treating Your Club Distance Guide as a Living Document
A printed chart becomes obsolete as soon as the golfer changes the equipment or the delivery. The working version should be treated like a record that gets updated after meaningful changes, not a permanent label taped to a bag.
Retest Trigger Checklist
| Trigger | Action | Minimum Retest |
|---|---|---|
| New club | Measure the new club and inspect both neighboring gaps | 5 shots per club |
| Shaft change | Rebuild the affected club's carry and dispersion record | 5 shots per club |
| Swing-speed shift over 3 mph | Recheck the set for compressed or stretched gaps | 5 shots per club |
| Season change | Repeat the same-ball comparison in a consistent temperature window | 5 shots per club |
| Altitude above 5,000 feet | Create a separate altitude-labeled chart | 5 shots per club |
| 90 days since the last session | Run a maintenance check across the bag | 5 shots per club |
The minimum retest uses 5 shots per club, the same ball, and the same temperature window. A full audit uses 10 shots, adds the dispersion ellipse, and records wind notes. The two protocols serve different purposes. The minimum check catches obvious movement, while the full audit supports a fitting decision.
Fit, remove, or leave the bag alone
Fit a new club when a meaningful carry window remains uncovered and a candidate produces a repeatable result. Remove or replace a redundant club when its carry overlaps another and its dispersion doesn't offer a clear strategic advantage. Leave the bag alone when the gaps are sound but the strike pattern is unstable. That last diagnosis matters because equipment can't repair every delivery problem.
A recent data point from Golf Digest reported Cobra data indicating that 42% of golfers have at least one gapping problem, 19% have two, and 38% have three or more, as summarized in its gapping coverage. The numbers support the need for an audit, but they don't identify the correct club for any individual golfer. Only the golfer's own carry and dispersion record can do that.
Dialed Golf keeps the workflow connected across its products. The consumer app functions as a pocket caddy and is currently available through TestFlight rather than general App Store availability, while the desktop product is built for launch-monitor practice at a range or garage simulator, with live pairing first for Garmin R10 and expanding, plus CSV and import workflows from Garmin, Rapsodo, SkyTrak, FlightScope, Uneekor, GSPro, Awesome Golf, and more. Dialed Academy provides memberships and front-desk tools for ranges and clubs at $99.99 per month or $999.99 per year, with the club keeping its dues, while free web tools remain free and Golfer Pro is offered across app and desktop at $9.99 per week, $29.99 per month, $149.99 per 6 months, or $249.99 per year.
The chart updates, the bag responds, and the scorecard follows.
Build the next version of the club distance guide from measured carry, imported launch-monitor sessions, and a clear gap audit rather than a generic chart. Use Dialed Golf to connect on-course planning with desktop practice data, then turn the largest dead zone into the next focused equipment or practice decision.