

A golfer finishes a range session, exports the launch monitor file, and opens a spreadsheet expecting an answer. The carry column looks tidy enough, but the average distance doesn't explain why several shots finished left, why one miss flew unusually far, or whether the latest swing change made the club more predictable.
That frustration is the practical reason to learn how to calculate dispersion. Average carry describes the center of a result, not the shape of the shot group. Dispersion shows how widely shots spread, where the group is centered, and whether a club produces a repeatable miss that can be managed on the course. The difference turns a raw export into a practice decision.
Table of Contents
- Understanding Why Raw Distance Isn't Enough
- Importing Your Launch Monitor Data
- Calculating Standard Deviation and Variance
- Visualizing Radial Dispersion and Group Centroid
- Interpreting Dispersion for Better Practice
- Troubleshooting Common Data Issues
Understanding Why Raw Distance Isn't Enough
A seven-iron session can produce an attractive average while still creating an uncomfortable club on the course. Suppose two golfers both average the same carry distance. One golfer's shots cluster close to the target line, while the other golfer produces a broad left-right pattern with a few strong strikes mixed among mishits. Their averages match, but their playing decisions shouldn't.
The CSV file makes this problem obvious. It contains rows of shots, yet the average carry column compresses those rows into one number. That number can help with gapping, but it can't tell the golfer whether the group is tight, whether the misses favor one side, or whether the longest shots came from a repeatable delivery.
Practical rule: Treat average distance as the center of the conversation, not the conclusion.
The shot group matters more than the headline number
Dispersion describes the spread around a central value or target. In golf, that spread may involve carry, total distance, offline position, launch direction, or a combination of distance and direction. The right measure depends on the question being asked.
A golfer comparing two seven-iron sessions might care about offline spread because approach misses determine which side of the green stays in play. A golfer building a club chart might care about carry variability because a narrow carry window makes club selection easier. A coach might examine both, because a tight group that consistently finishes right points to a different practice priority than a wide group centered on target.
The same logic applies to driver analysis. A driver ball speed chart can help organize speed and distance information, but speed alone doesn't reveal where the resulting shots finish. A golfer needs the landing pattern as well as the launch number.
From average to actionable pattern
The useful questions sound more like these:
- How wide is the group? This indicates how predictable the result is.
- Where is the group centered? This identifies a consistent directional bias.
- Which shots belong in the sample? This protects the calculation from obvious sensor errors or unrelated swings.
- Does the pattern repeat? A single session can suggest a direction, but repeated sessions create a more credible practice history.
Averages still have a role. They help golfers estimate carry windows and compare clubs. They shouldn't stand in for dispersion. Until the shot coordinates are measured, the golfer is still looking at performance through a narrow opening.
Importing Your Launch Monitor Data
Dispersion analysis starts with a clean shot record. Dialed Desktop is built around that bridge between a launch monitor session and a usable practice view, with a desktop-first live pairing workflow for the Garmin R10 and expanding support for imported files from Garmin, Rapsodo, SkyTrak, FlightScope, Uneekor, GSPro, Awesome Golf, and other launch-monitor or simulator systems.
Garmin users can export a driving-range session as a CSV, while the broader Garmin export flow can produce a downloadable data dump with DI_CONNECT and DI_GOLF folders. Documentation on importing golf shot data describes the export and import mechanics behind this kind of workflow.
A clean import sequence
Export the session. Save the original file before editing anything. The untouched export preserves a reference point if a column mapping or filter needs to be reviewed later.
Choose the correct session. A range file, a simulator session, and a mixed practice file may contain different shot types. Keep the sample focused on the club and task being evaluated.
Load the CSV into Dialed Desktop. The software maps available shot-level fields into a session that can be inspected and visualized. The purpose isn't merely to store rows. It's to turn columns into positions, distances, and patterns that can be analyzed together.
Check the mapped fields. Confirm that carry, direction, and other relevant variables are populated. Launch-monitor exports can include club speed, ball speed, launch angle, launch direction, spin rate, spin axis, backspin, sidespin, carry distance, total distance, club path, face angle, face-to-path, attack angle, smash factor, apex height, and spin-rate type, depending on the system and export. A field reference for launch-monitor CSV data shows the breadth of variables that may be available.

A CSV import workflow for golf practice data is most useful when the source columns remain traceable. If a file lacks offline coordinates, the system can't create a meaningful two-dimensional landing pattern from that file alone. The calculation may still describe carry variation, but it won't answer the directional question.
Dialed Desktop also supports live pairing first on desktop, rather than treating mobile as the primary live-monitor interface. Mobile live pairing is planned later, while the desktop workflow handles the range or garage-simulator analysis where larger exports are easiest to review.
Calculating Standard Deviation and Variance
Variance is the average of the squared deviations from the mean. For a population, the common expression is:
σ² = (1/N)∑(xᵢ − μ)²
Here, each shot value is compared with the mean, the difference is squared, and the squared differences are averaged. Squaring prevents positive and negative deviations from canceling each other. It also gives larger misses more influence, which is useful when the goal is to measure the full spread rather than only the typical small fluctuation.
Golfers usually work with a sample of swings, not every shot they could ever hit. The sample version commonly uses n − 1 in the denominator to reduce estimation bias. The distinction matters because the result is intended to describe a broader playing pattern, not merely reproduce the exact rows in one limited session. The historical development of squared deviations is associated with work by Abraham de Moivre and Carl Friedrich Gauss, while Karl Pearson later standardized the term “standard deviation,” as outlined in this overview of measures of spread.
Why standard deviation is easier to use
Variance is expressed in squared units. If the input is yards, variance is in squared yards, which makes it mathematically useful but awkward for club selection. Standard deviation is the square root of variance, so it returns the result to the original unit.
That conversion is the practical payoff:
- A carry calculation returns a spread in carry units.
- An offline calculation returns a spread in the same directional units used to judge the target.
- A distance calculation can be compared with the golfer's normal club gaps without mentally undoing squared units.
The mean provides the center of the data. Variance measures how far the observations move from that center. Standard deviation translates the result into a form a golfer can interpret.
Connecting the formula to the shot group
For a one-dimensional carry session, the mean carry is the centroid's distance component. Each shot's carry is compared with that mean, and the resulting standard deviation describes the typical scale of variation around it. For two-dimensional dispersion, the same idea is applied to the shot positions, with the group centroid representing the average landing location across the relevant coordinates.
The calculation shouldn't be treated as a magic consistency score. A lower value generally means a tighter group for the selected variable, but the value is only meaningful when the shots, target, club, and coordinate definitions are consistent. A carry deviation and an offline deviation answer different questions, even when both use the same mathematical foundation.
Visualizing Radial Dispersion and Group Centroid
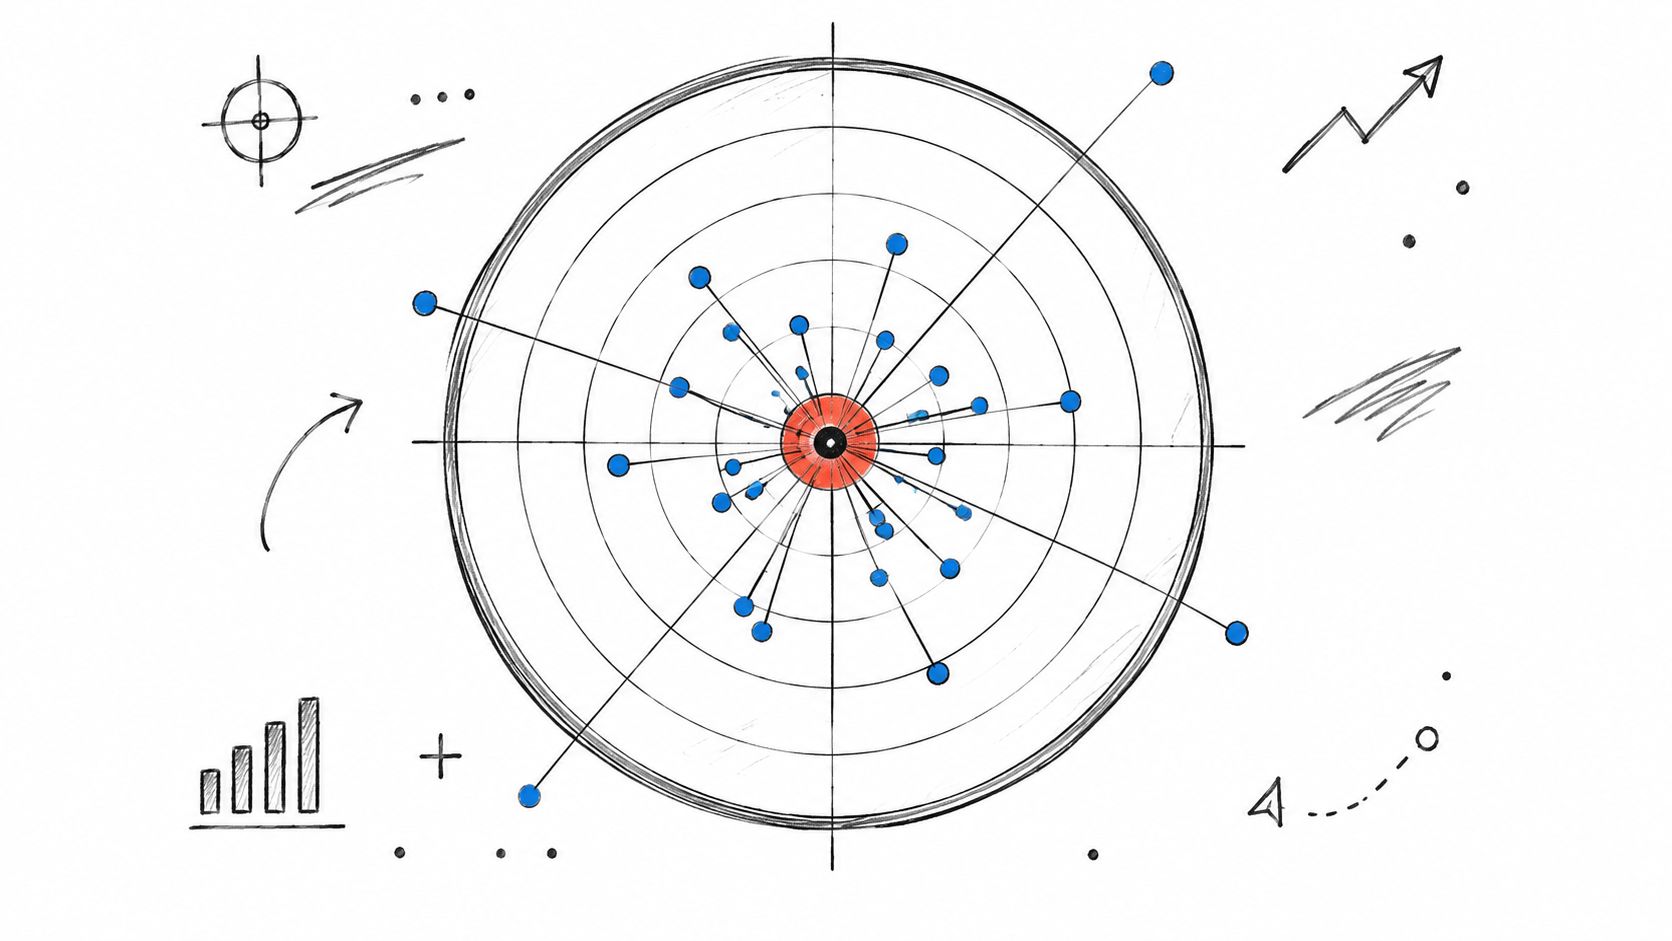
A formula becomes easier to trust when the golfer can see the shots it summarizes. A radial dispersion chart places each landing point on a two-dimensional plane, commonly with distance from the target and offline direction represented as separate coordinates. The resulting cloud shows whether the group is compact, stretched, or biased.
The group centroid is the average landing position of the shots. It isn't necessarily the target. If the centroid sits to the right of the intended line, the golfer may have a repeatable directional bias even when the group itself is relatively tight. That distinction separates a centered, inconsistent group from a consistent group that needs an aim or delivery adjustment.
Read the center and the spread separately
Consider two simplified patterns:
| Pattern | What the chart shows | Likely practice question |
|---|---|---|
| Tight but offline | Shots sit close together, with the centroid away from the target | Is the golfer aiming correctly, or is the delivery creating a stable bias? |
| Wide but centered | The centroid is near the target, but the shots spread broadly | What is causing inconsistent contact, face delivery, or launch direction? |
The radial boundary adds another layer. It expands around the centroid according to the selected spread measure, giving the golfer a visual estimate of the group's typical reach. It shouldn't be confused with a guarantee that every future shot will remain inside the shape. A dispersion visualization describes the selected sample and helps the golfer make a decision about risk.
The strongest interpretation combines three observations: where the centroid sits, how far the group extends, and which direction the outer shots favor. A golfer who looks only at the boundary may miss a systematic bias. A golfer who looks only at the centroid may overlook a group too wide for reliable approach play.
Turn the chart into a target decision
The chart earns its place when it changes practice. A right-biased group might lead to a start-direction check, a clubface review, or an aim adjustment. A long and narrow pattern might point to distance control rather than direction. A broad, irregular cloud may justify checking strike quality and data validity before changing technique.
The visualization doesn't replace coaching or judgment. It gives both a clearer starting point by showing the difference between a miss that repeats and a miss that merely appears in a noisy sample.
Interpreting Dispersion for Better Practice
A golfer doesn't calculate dispersion to admire a smaller number. The point is to decide what deserves attention during the next practice session.
Average carry and dispersion answer different questions. Average carry asks, “How far does this club go on average?” Dispersion asks, “How dependable is that result, and where does the miss tend to go?” A club can produce a useful average while creating a wide or one-sided landing pattern. Another club can have a less impressive average but offer a tighter, more manageable group.
Compare like with like
Standard deviation works well when the same variable and similar club context are being compared. A golfer reviewing two sessions with the same club can examine whether the group tightened, shifted, or both. The mean remains important, because a tighter group that has moved materially shorter may require a separate gapping decision.
The coefficient of variation adds context when datasets have different scales. It is calculated as:
CV = (standard deviation / mean) × 100
A dataset with a mean of 50 and a standard deviation of 5 has a 10% CV, while a dataset with a mean of 200 and the same standard deviation of 5 has a 2.5% CV. The second dataset has the same raw spread but less relative variability. This comparison is explained in the coefficient of variation reference.
Choose the metric for the decision
Use standard deviation when the golfer needs the spread in familiar units. Use the coefficient of variation when comparing relative variability across substantially different means. Use a range when a quick look at the shortest and longest observations is useful, but don't let that pair alone define consistency.
A practical club review might track:
- Mean carry: the central distance.
- Standard deviation: the typical spread in the selected variable.
- Centroid: the average landing position relative to the target.
- Carry window: the interval the golfer can reasonably plan around.
- Directional tendency: the side of the target that receives more misses.
A gap-analysis workflow for golf clubs becomes more useful when carry and dispersion are reviewed together. The golfer can then decide whether a club needs a loft change, a practice adjustment, a different target strategy, or more trustworthy data.
Troubleshooting Common Data Issues
A dispersion result is only as credible as the session behind it. A sensor glitch, an accidental half swing, or a severe mishit can pull the mean away from the normal group and inflate the standard deviation. Removing an obvious error isn't an attempt to hide a bad shot. It's an attempt to keep a defined practice sample from mixing unrelated events.
The first review should happen in the shot log, before the final number is accepted. Mark shots that don't belong to the test, then document the reason for excluding them. The golfer should be able to explain whether a row was removed because it was a wrong club, a deliberate low shot, a clear sensor error, or an unusual strike that the session was specifically intended to study.
Validate the sample
A small sample can produce an unstable result. A session containing only a handful of shots may look unusually tight or unusually wide by chance, so it shouldn't automatically drive a club or swing change. Reliable dispersion guidance also supports using measures such as the interquartile range alongside variance and standard deviation, particularly when outliers are present, as described in this reference on statistical dispersion.
Before acting on a chart, check:
- Session consistency: Were the same club, ball, target, and shot intention used throughout?
- Coordinate quality: Are carry and directional fields populated and mapped correctly?
- Outlier reason: Does each extreme shot represent a real golf event or a data problem?
- Direction convention: Does left and right appear consistently across the session?
- Result stability: Does the pattern still make sense after obvious errors are removed?
Don't let cleaning become hiding
Filtering should make the test more honest, not more flattering. If a golfer removes every miss that widens the group, the final number no longer describes playing performance. A better approach is to keep the original export, create a clearly labeled analysis set, and retain the excluded rows for review.
Dialed Desktop can help golfers filter and clean imported shot data before interpreting the final visualization. That makes the workflow practical, but it doesn't remove the need for judgment. A sensible validation check is to compare the cleaned group with the original session and ask whether the conclusion still matches what happened on the range.
A golfer should change a club or swing plan only when the data, the visible shot pattern, and the on-course problem point in the same direction. Dispersion is most valuable when it narrows the decision, not when it creates another number to chase.
Dialed Golf connects a pocket-caddy consumer app, desktop launch-monitor practice with live pairing and CSV imports, and Dialed Academy memberships and front-desk tools for ranges and clubs. Golfer Pro is available across the app and desktop at $9.99 per week, $29.99 per month, $149.99 for 6 months, or $249.99 per year, while Dialed Academy is $99.99 per month or $999.99 per year and the club keeps its dues. Visit Dialed Golf to bring raw launch-monitor sessions, dispersion visualizations, and practical practice decisions into one golfer record.